Characteristics of pediatric SARS-CoV-2 infection and potential evidence for persistent fecal viral shedding xu2020characteristics
This study reported the epidemiological and clinical features of ten children infected with SARS-CoV-2 confirmed by real-time reverse transcription PCR assay of SARS-CoV-2 RNA and tested for evidence of viral excretion through the gastrointestinal and respiratory tracts. A total of 107 samples in both of nasopharyngeal and rectal swabs were collected and ct values were recorded by days after admission. The standard curve of transforming ct value into viral load was calculated based on the concentration provided by the author.
Analytes
rectal_swab_SARSCoV2
SARS-CoV-2 RNA copy number concentration in rectal swab samples. The unit of concentration were converted to copies per ml from Ct values based on standard curve calculated from the concentration provided by the author.
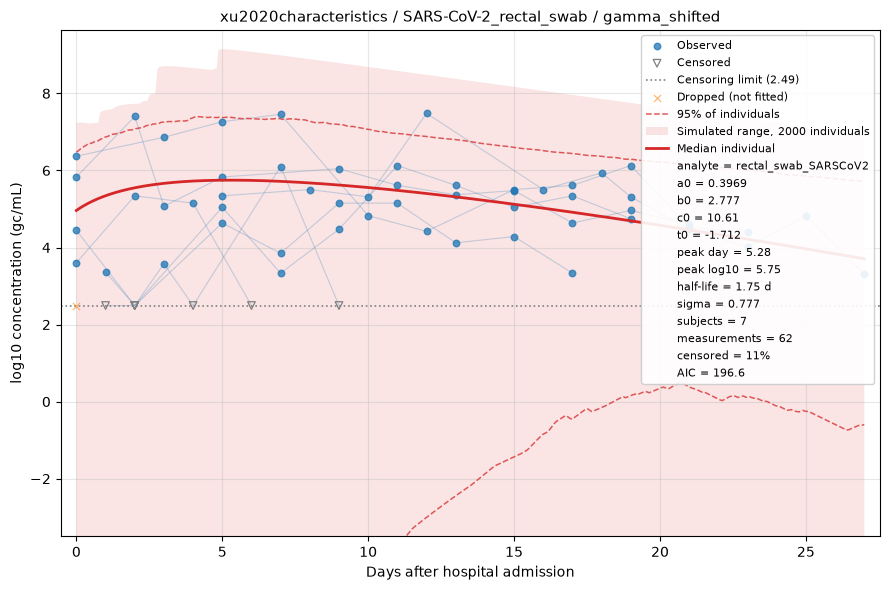
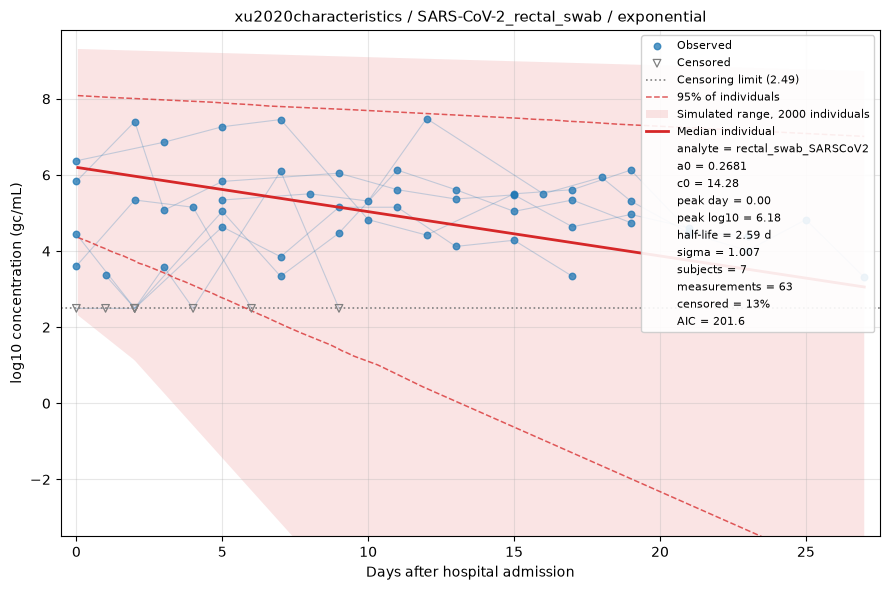
Fitted by censored maximum likelihood. The red line is the median individual; the shaded region is the full range of a simulated cohort drawn from the fitted population, so it shows what simulating from this dataset would produce rather than a confidence interval, with dashed lines at the central 95%. Open triangles are non-detects, drawn at the censoring limit and entering the fit as "below this value" rather than being dropped. See the modelling methods for what these estimates do and do not support.
nasopharyngeal_swab_SARSCoV2
SARS-CoV-2 RNA copy number concentration in nasopharyngeal swab samples. The unit of concentration were converted to copies per ml from Ct values based on standard curve calculated from the concentration provided by the author.
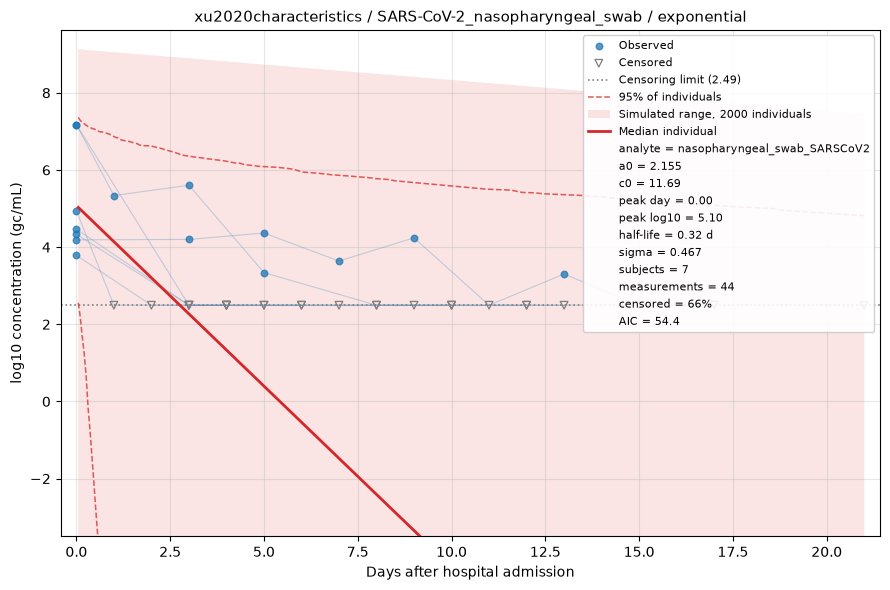
Fitted by censored maximum likelihood. The red line is the median individual; the shaded region is the full range of a simulated cohort drawn from the fitted population, so it shows what simulating from this dataset would produce rather than a confidence interval, with dashed lines at the central 95%. Open triangles are non-detects, drawn at the censoring limit and entering the fit as "below this value" rather than being dropped. See the modelling methods for what these estimates do and do not support.