Individual Correlates of Infectivity of Influenza A Virus Infections in Households tsang2016individual
The community-based study reports the transmission of Influenza A virus within households from February 2008 through December 2012, focusing on viral loads in nasal and throat swabs from index cases and their household contacts.
Analytes
NPSOPS
Influenza A virus RNA gene copy concentration in oropharynx and nasopharynx samples. Paired nasal and throat swabs were pooled in viral transport medium immediately after collection and subsequently processed for quantitative reverse transcription PCR to detect and quantify influenza A virus. The concentration was quantified in gene copies per milliliter. M gene was used as the gene target for the PCR assay, as described in a referenced study (Chan et al., 2008).
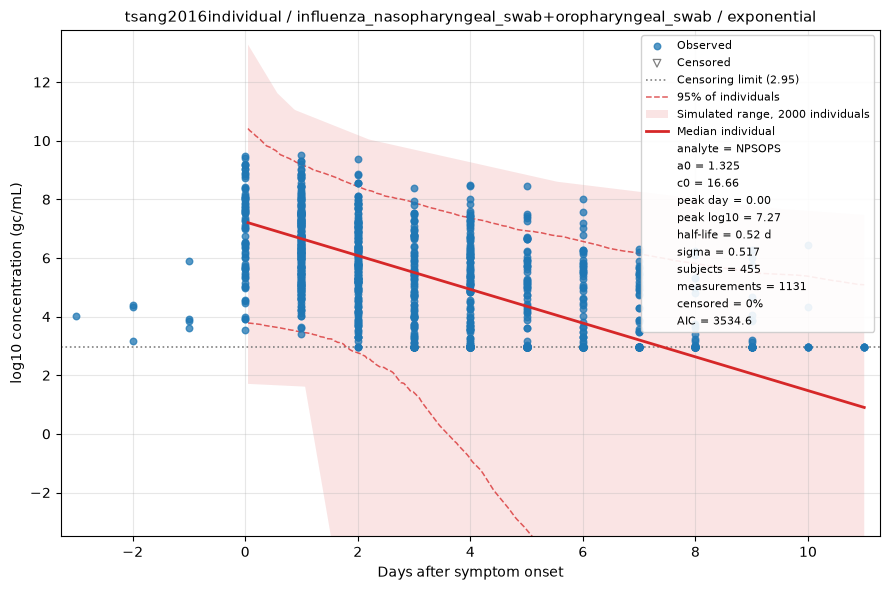
Fitted by censored maximum likelihood. The red line is the median individual; the shaded region is the full range of a simulated cohort drawn from the fitted population, so it shows what simulating from this dataset would produce rather than a confidence interval, with dashed lines at the central 95%. Open triangles are non-detects, drawn at the censoring limit and entering the fit as "below this value" rather than being dropped. See the modelling methods for what these estimates do and do not support.