Distribution of Transmission Potential During Nonsevere COVID-19 Illness shrestha2020distribution
This study evaluated the transmission potential of COVID-19 by examining viral load over time. Over six weeks, 230 healthcare personnel underwent 528 tests at the Cleveland Clinic. Cycle threshold (Ct) values were obtained using RT-PCR targeting the N gene, and viral loads were calculated. Data were obtained from the combined dataset in the supplementary materials of Challenger et al. BMC Medicine (2022) 20:25 (https://doi.org/10.1186/s12916-021-02220-0).
Analytes
swab_SARSCoV2_N_Ct
Cycle threshold (Ct) values were quantified using RT-PCR targeting the N gene in nasopharyngeal swab samples.
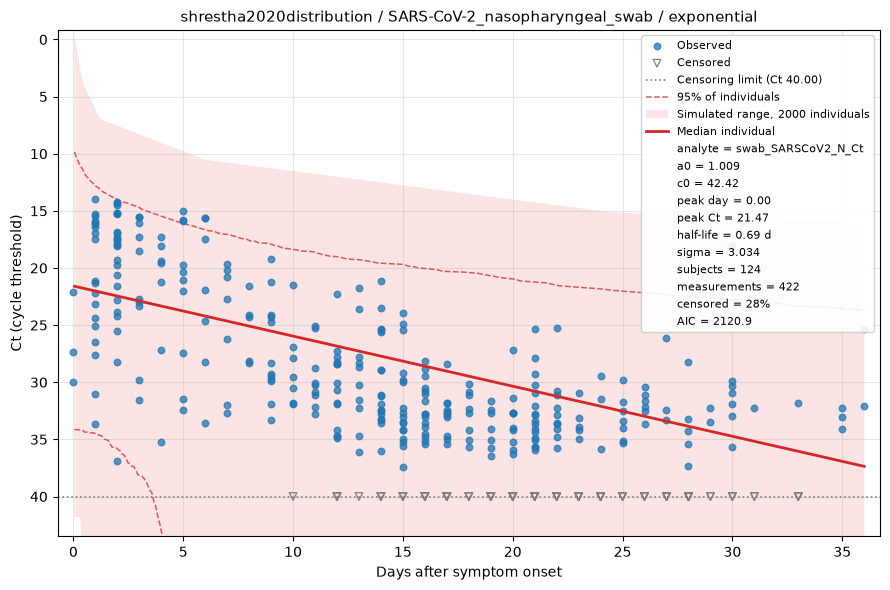
Fitted by censored maximum likelihood. The red line is the median individual; the shaded region is the full range of a simulated cohort drawn from the fitted population, so it shows what simulating from this dataset would produce rather than a confidence interval, with dashed lines at the central 95%. Open triangles are non-detects, drawn at the censoring limit and entering the fit as "below this value" rather than being dropped. See the modelling methods for what these estimates do and do not support.