Effective Aerosol Inoculation of Dose-Escalated Seasonal Influenza H3N2 Virus in Controlled Human Infection Model rouphael2025effective
Dose-escalation controlled human infection study (Feb 2024–Mar 2025) evaluating aerosolized inoculation of influenza A/Perth/16/2009 (H3N2) using two devices (FMAG and a medical nebulizer) in 14 healthy adults (aged 18–49). Participants were challenged in an inpatient unit and monitored daily; molecular (qPCR) and infectious (plaque assay) viral loads were measured at multiple upper airway sites (nasopharynx, anterior nares, buccal, oropharynx, saliva). Study assessed viral shedding kinetics, symptom development (MMID), safety, and seroconversion.
Analytes
nasopharyngeal_gc_ml
Quantitative molecular detection of influenza viral RNA from nasopharyngeal swab samples by RT-PCR, reported as gene copies per mL (gc/mL).
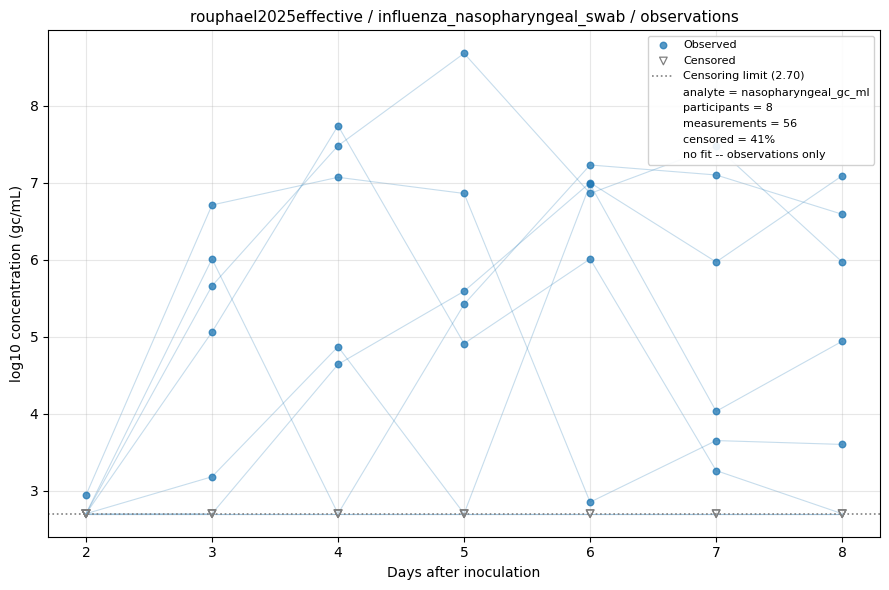
Measurements only — no shedding model is fitted to this analyte, usually because it is sampled once per participant, leaving no trajectory to fit, or because nothing was ever detected. Open triangles are non-detects, drawn at the assay's censoring limit. See the modelling methods for what these estimates do and do not support.
anterior_nasal_gc_ml
Quantitative molecular detection of influenza viral RNA from anterior nasal (anterior nares) swab samples by RT-PCR, reported as gene copies per mL (gc/mL).
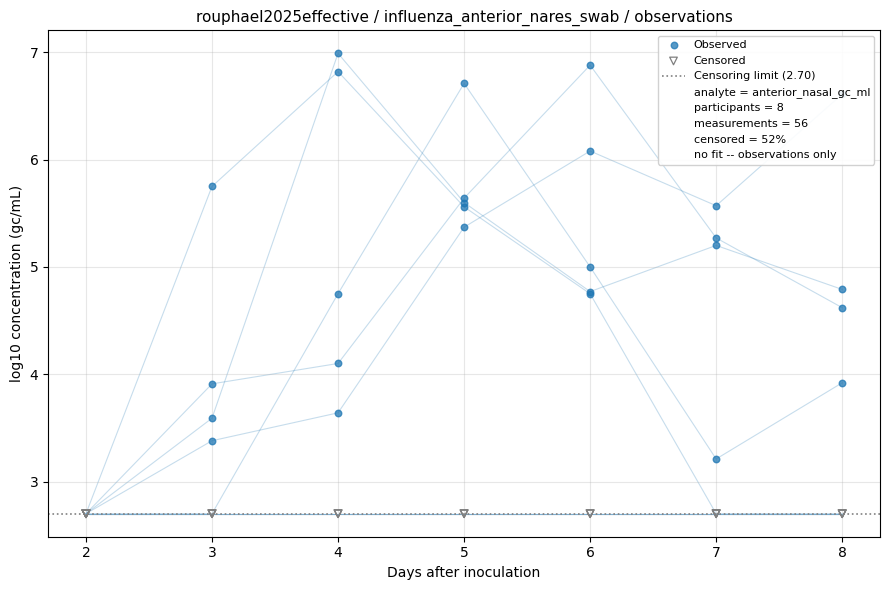
Measurements only — no shedding model is fitted to this analyte, usually because it is sampled once per participant, leaving no trajectory to fit, or because nothing was ever detected. Open triangles are non-detects, drawn at the assay's censoring limit. See the modelling methods for what these estimates do and do not support.
buccal_gc_ml
Quantitative molecular detection of influenza viral RNA from buccal swab samples (inner cheek) by RT-PCR, reported as gene copies per mL (gc/mL).
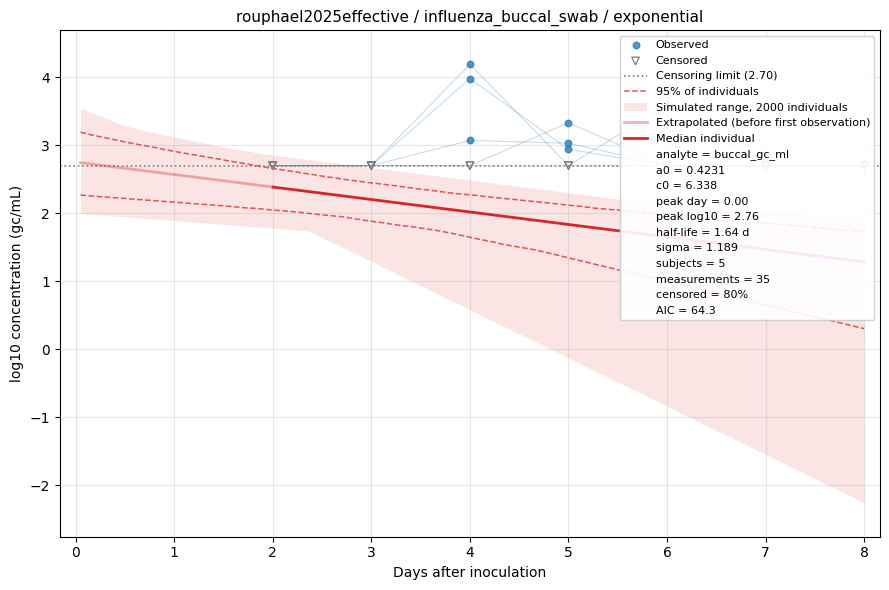
Fitted by censored maximum likelihood. The red line is the median individual; the shaded region is the full range of a simulated cohort drawn from the fitted population, so it shows what simulating from this dataset would produce rather than a confidence interval, with dashed lines at the central 95%. Open triangles are non-detects, drawn at the censoring limit and entering the fit as "below this value" rather than being dropped. See the modelling methods for what these estimates do and do not support.
oropharyngeal_gc_ml
Quantitative molecular detection of influenza viral RNA from oropharyngeal swab samples by RT-PCR, reported as gene copies per mL (gc/mL).
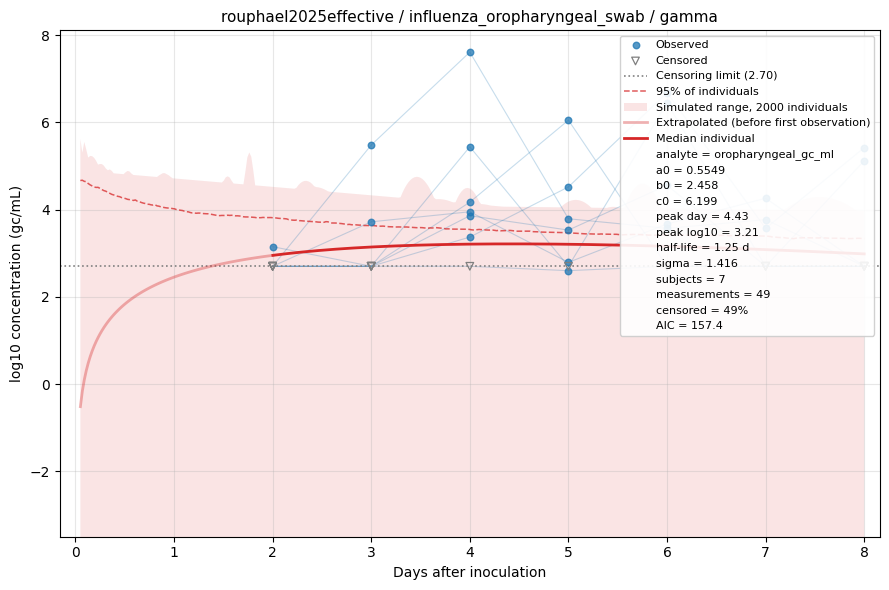
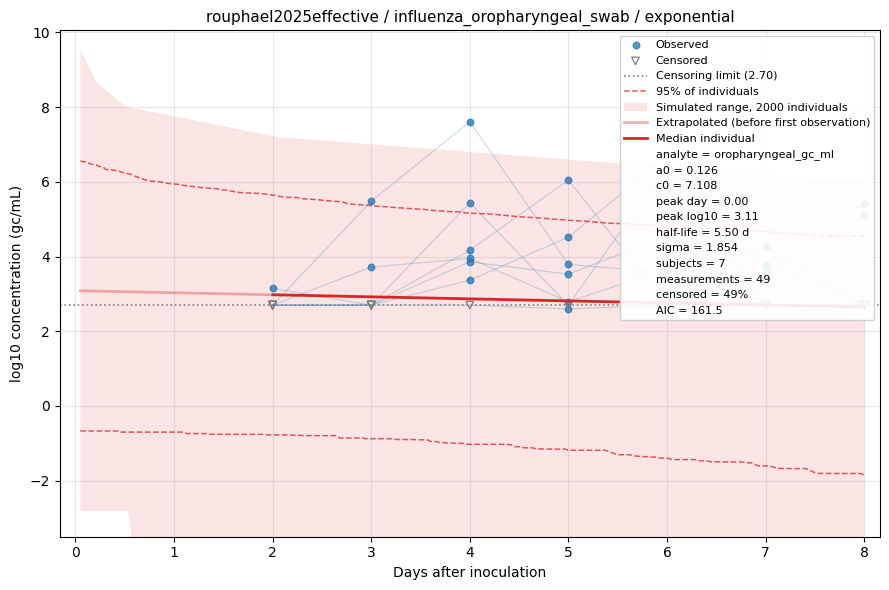
Fitted by censored maximum likelihood. The red line is the median individual; the shaded region is the full range of a simulated cohort drawn from the fitted population, so it shows what simulating from this dataset would produce rather than a confidence interval, with dashed lines at the central 95%. Open triangles are non-detects, drawn at the censoring limit and entering the fit as "below this value" rather than being dropped. See the modelling methods for what these estimates do and do not support.
saliva_gc_ml
Quantitative molecular detection of influenza viral RNA from saliva samples by RT-PCR, reported as gene copies per mL (gc/mL).
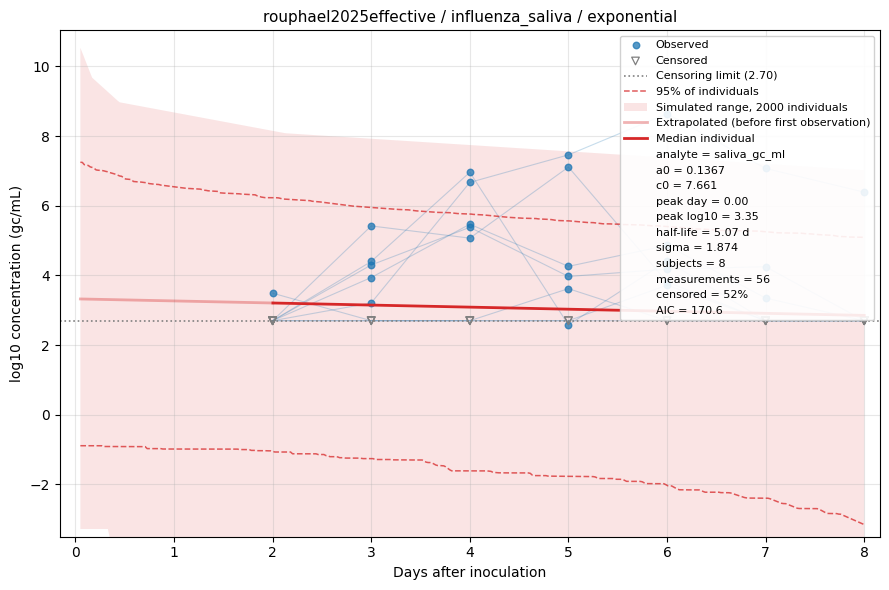
Fitted by censored maximum likelihood. The red line is the median individual; the shaded region is the full range of a simulated cohort drawn from the fitted population, so it shows what simulating from this dataset would produce rather than a confidence interval, with dashed lines at the central 95%. Open triangles are non-detects, drawn at the censoring limit and entering the fit as "below this value" rather than being dropped. See the modelling methods for what these estimates do and do not support.
nasopharyngeal_pfu_ml
Infectious virus quantification by plaque assay from nasopharyngeal swab samples, reported as plaque-forming units per mL (pfu/mL).
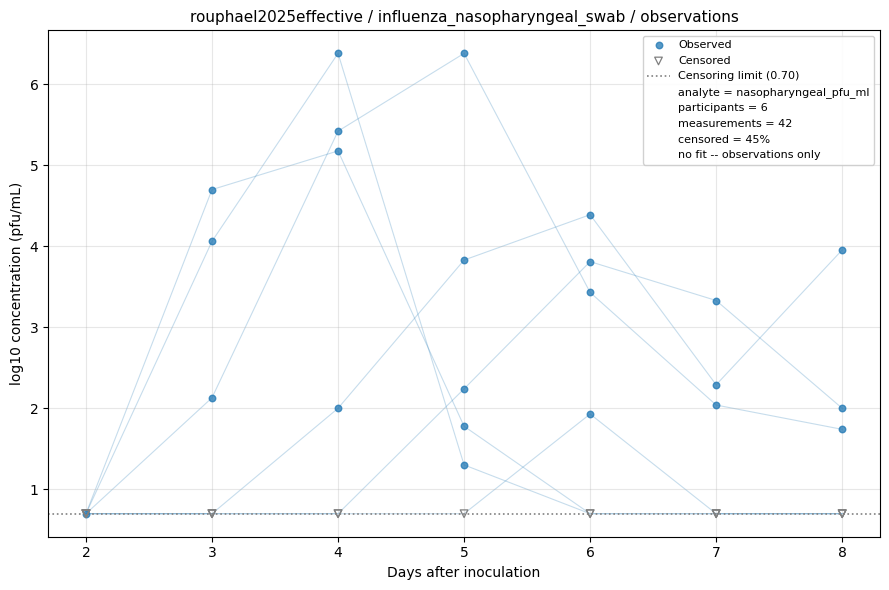
Measurements only — no shedding model is fitted to this analyte, usually because it is sampled once per participant, leaving no trajectory to fit, or because nothing was ever detected. Open triangles are non-detects, drawn at the assay's censoring limit. See the modelling methods for what these estimates do and do not support.
anterior_nasal_pfu_ml
Infectious virus quantification by plaque assay from anterior nasal (anterior nares) swab samples, reported as plaque-forming units per mL (pfu/mL).
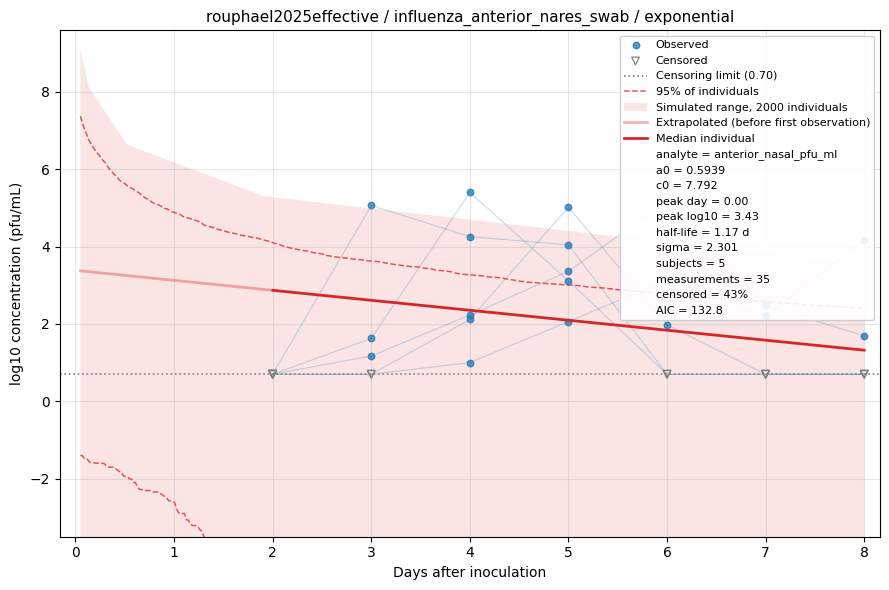
Fitted by censored maximum likelihood. The red line is the median individual; the shaded region is the full range of a simulated cohort drawn from the fitted population, so it shows what simulating from this dataset would produce rather than a confidence interval, with dashed lines at the central 95%. Open triangles are non-detects, drawn at the censoring limit and entering the fit as "below this value" rather than being dropped. See the modelling methods for what these estimates do and do not support.
buccal_pfu_ml
Infectious virus quantification by plaque assay from buccal swab samples, reported as plaque-forming units per mL (pfu/mL).
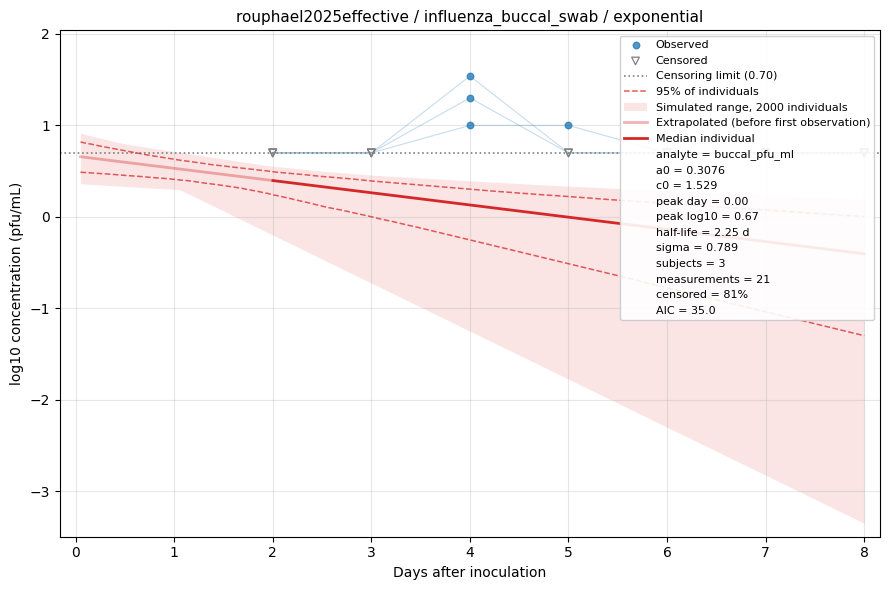
Fitted by censored maximum likelihood. The red line is the median individual; the shaded region is the full range of a simulated cohort drawn from the fitted population, so it shows what simulating from this dataset would produce rather than a confidence interval, with dashed lines at the central 95%. Open triangles are non-detects, drawn at the censoring limit and entering the fit as "below this value" rather than being dropped. See the modelling methods for what these estimates do and do not support.
oropharyngeal_pfu_ml
Infectious virus quantification by plaque assay from oropharyngeal swab samples, reported as plaque-forming units per mL (pfu/mL).
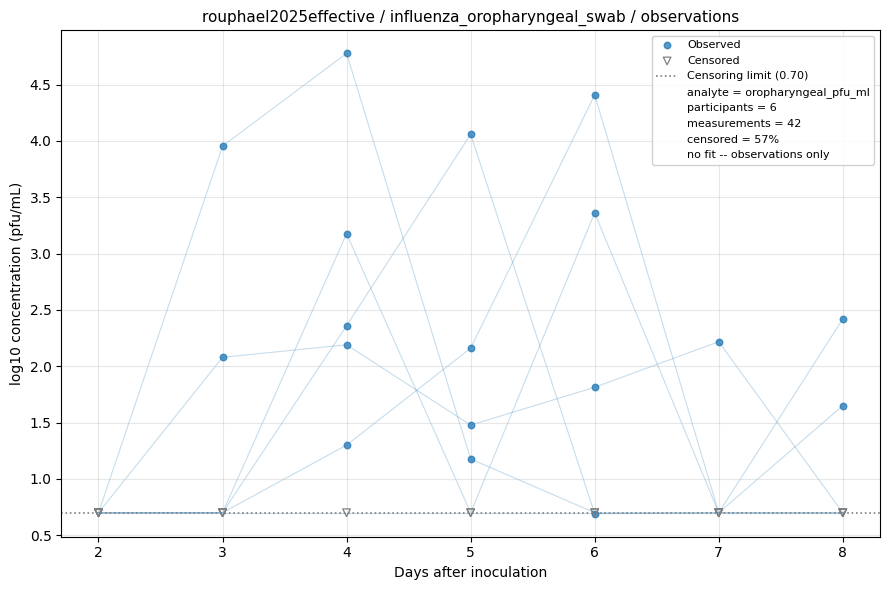
Measurements only — no shedding model is fitted to this analyte, usually because it is sampled once per participant, leaving no trajectory to fit, or because nothing was ever detected. Open triangles are non-detects, drawn at the assay's censoring limit. See the modelling methods for what these estimates do and do not support.
saliva_pfu_ml
Infectious virus quantification by plaque assay from saliva samples, reported as plaque-forming units per mL (pfu/mL).
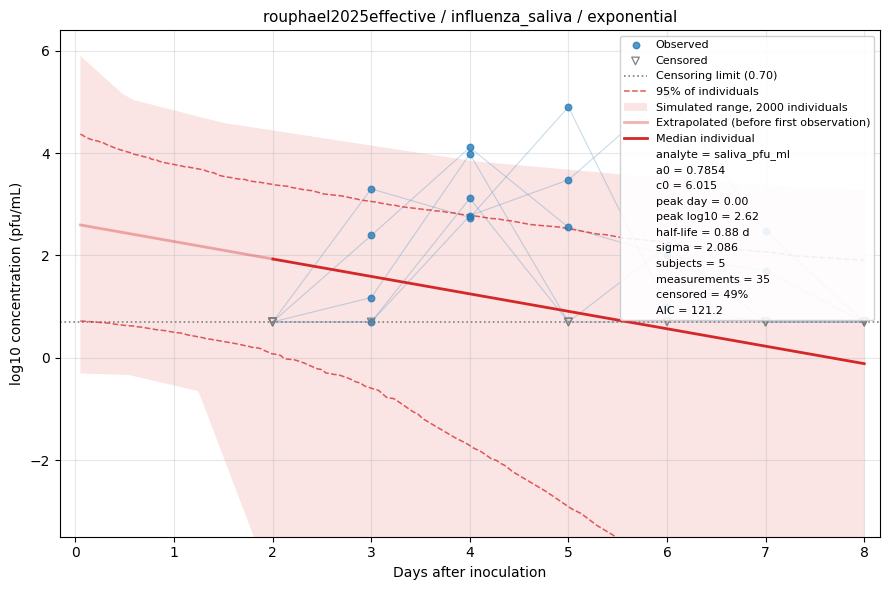
Fitted by censored maximum likelihood. The red line is the median individual; the shaded region is the full range of a simulated cohort drawn from the fitted population, so it shows what simulating from this dataset would produce rather than a confidence interval, with dashed lines at the central 95%. Open triangles are non-detects, drawn at the censoring limit and entering the fit as "below this value" rather than being dropped. See the modelling methods for what these estimates do and do not support.
nasopharyngeal_ct
RT-PCR cycle threshold (Ct) values from nasopharyngeal swab samples for influenza viral detection (unit: cycle threshold).
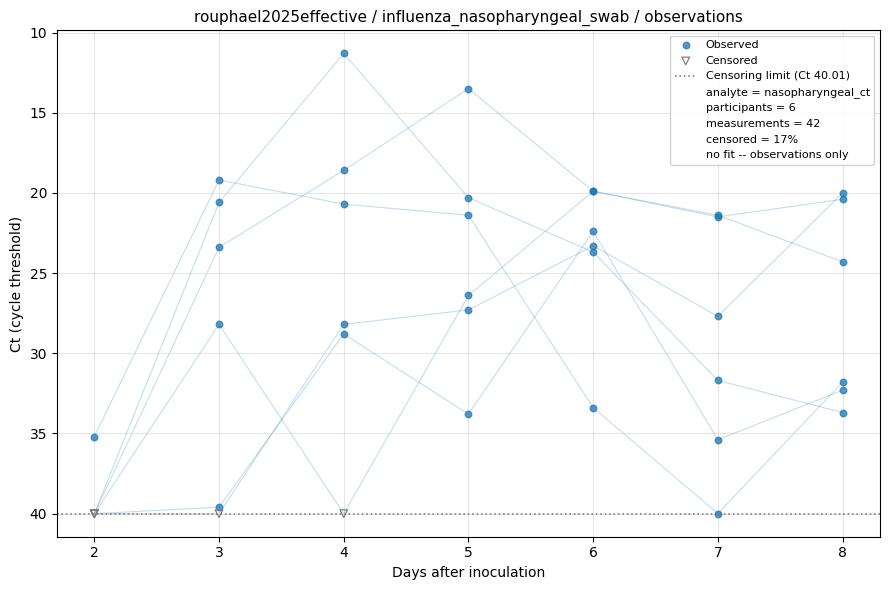
Measurements only — no shedding model is fitted to this analyte, usually because it is sampled once per participant, leaving no trajectory to fit, or because nothing was ever detected. Open triangles are non-detects, drawn at the assay's censoring limit. See the modelling methods for what these estimates do and do not support.