Clinical Characterization and Outcomes of Human Clade IIb Mpox Virus Disease: A European Multicenter Mpox Observational Cohort Study (MOSAIC) pesonel2025clinical
Multicenter observational cohort (MOSAIC) of laboratory-confirmed clade IIb mpox (MPXV) in 6 European countries (enrolled June 2022–July 2023). Participants were followed up to 6 months, with virologic monitoring by MPXV-specific real-time PCR (Ct values) on plasma, skin lesion swabs, oropharyngeal swabs, and anorectal swabs. PCR Ct≥40 was considered negative. CSV figure data provide individual longitudinal Ct measurements by patient and specimen; participants are categorized as treated vs untreated (systemic antivirals within 14 days of first PCR-positive sample) but no individual demographics are provided in the CSV.
Analytes
oropharyngeal_swab
MPXV-specific real-time PCR performed per local laboratory procedures; Ct value reported for oropharyngeal (throat) swab samples. Ct≥40 considered negative.
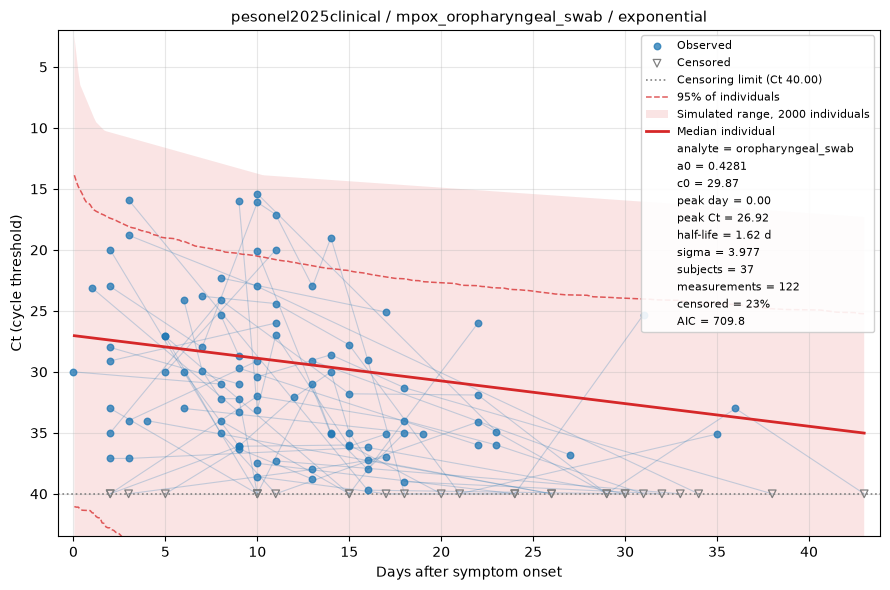
Fitted by censored maximum likelihood. The red line is the median individual; the shaded region is the full range of a simulated cohort drawn from the fitted population, so it shows what simulating from this dataset would produce rather than a confidence interval, with dashed lines at the central 95%. Open triangles are non-detects, drawn at the censoring limit and entering the fit as "below this value" rather than being dropped. See the modelling methods for what these estimates do and do not support.
anorectal_swab
MPXV-specific real-time PCR performed per local laboratory procedures; Ct value reported for anorectal swab samples. Ct≥40 considered negative.
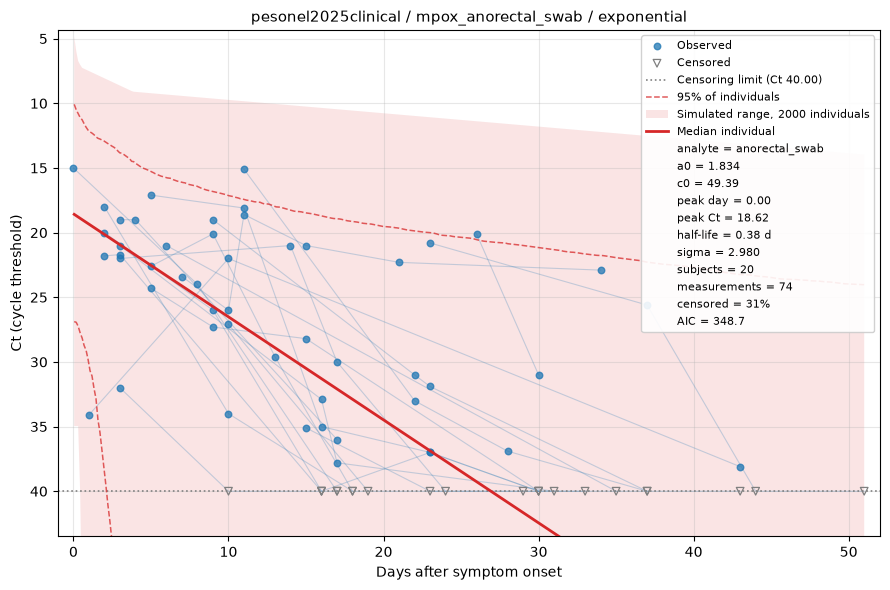
Fitted by censored maximum likelihood. The red line is the median individual; the shaded region is the full range of a simulated cohort drawn from the fitted population, so it shows what simulating from this dataset would produce rather than a confidence interval, with dashed lines at the central 95%. Open triangles are non-detects, drawn at the censoring limit and entering the fit as "below this value" rather than being dropped. See the modelling methods for what these estimates do and do not support.
skin
MPXV-specific real-time PCR performed per local laboratory procedures; Ct value reported for skin lesion swab samples (reported as ‘skin’ in CSV). Ct≥40 considered negative.
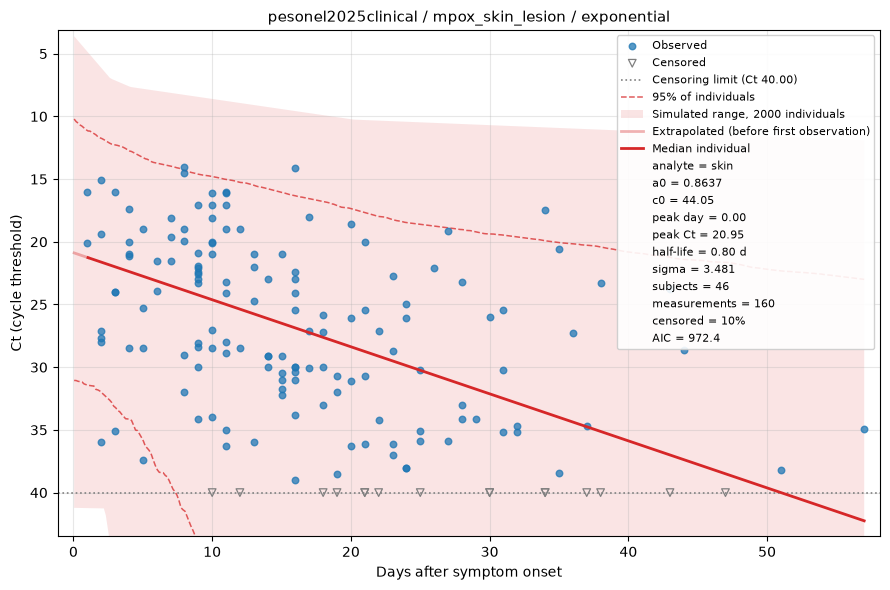
Fitted by censored maximum likelihood. The red line is the median individual; the shaded region is the full range of a simulated cohort drawn from the fitted population, so it shows what simulating from this dataset would produce rather than a confidence interval, with dashed lines at the central 95%. Open triangles are non-detects, drawn at the censoring limit and entering the fit as "below this value" rather than being dropped. See the modelling methods for what these estimates do and do not support.
plasma
MPXV-specific real-time PCR performed per local laboratory procedures; Ct value reported for plasma samples. Ct≥40 considered negative.
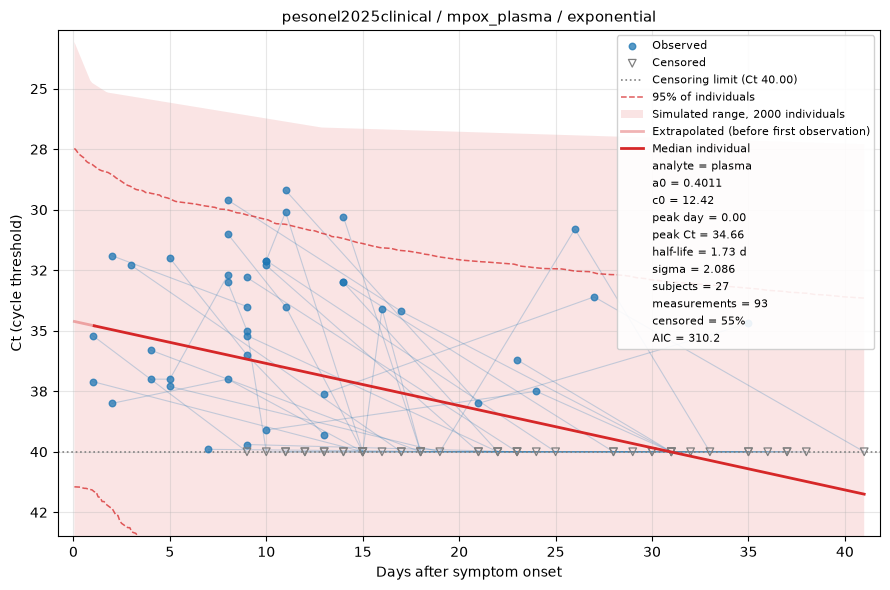
Fitted by censored maximum likelihood. The red line is the median individual; the shaded region is the full range of a simulated cohort drawn from the fitted population, so it shows what simulating from this dataset would produce rather than a confidence interval, with dashed lines at the central 95%. Open triangles are non-detects, drawn at the censoring limit and entering the fit as "below this value" rather than being dropped. See the modelling methods for what these estimates do and do not support.