Gastrointestinal symptoms and fecal shedding of SARS-CoV-2 RNA suggest prolonged gastrointestinal infection natarajan2022gastrointestinal
Fecal samples were collected from 113 participants “in a randomized controlled study of Peg-interferon lambda-1a versus a placebo control for the treatment of mild to moderate COVID-19.” A total of 7,563 measurements were taken for 679 samples using seven distinct assays; assays were typically run in duplicates.
Samples were initially collected using OMNIGene GUT collection tubes (OG) but subsequently replaced with Zymo DNA/RNA shield fecal collection tubes (ZY) because of better performance. There are consequently 14 analytes following the naming convention {target gene E, RdRP, N1, or N2}-{genomic RNA (gRNA) or subgenomic RNA (sgRNA)}-{quantification method RT-qPCR or ddPCR}-{collection tube OG or ZY}.
The reference event for temporal offsets in days is the day of enrollment.
Analytes
E-gRNA-RT-qPCR-OG
Concentration of genomic RNA of the E gene quantified using RT-qPCR for a sample collected using the OMNIGene GUT collection tube.
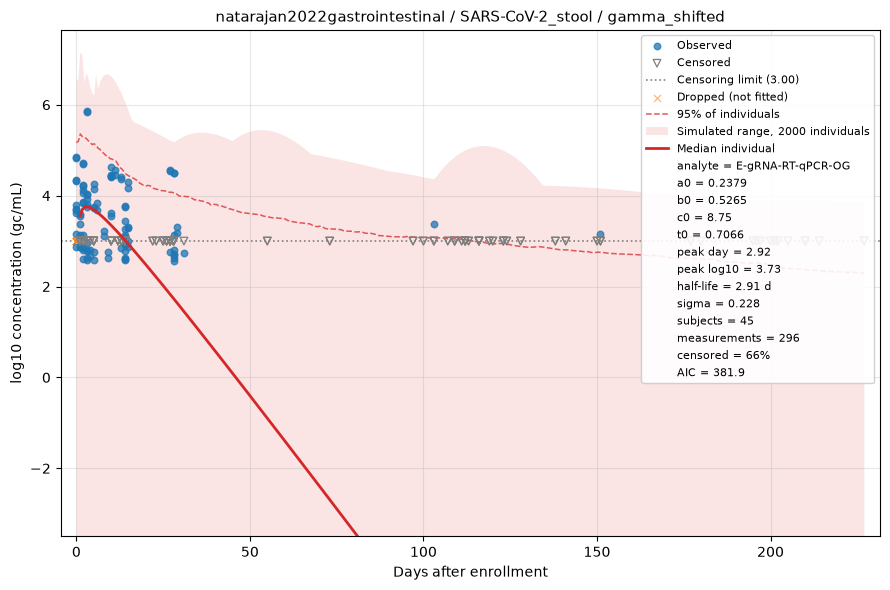
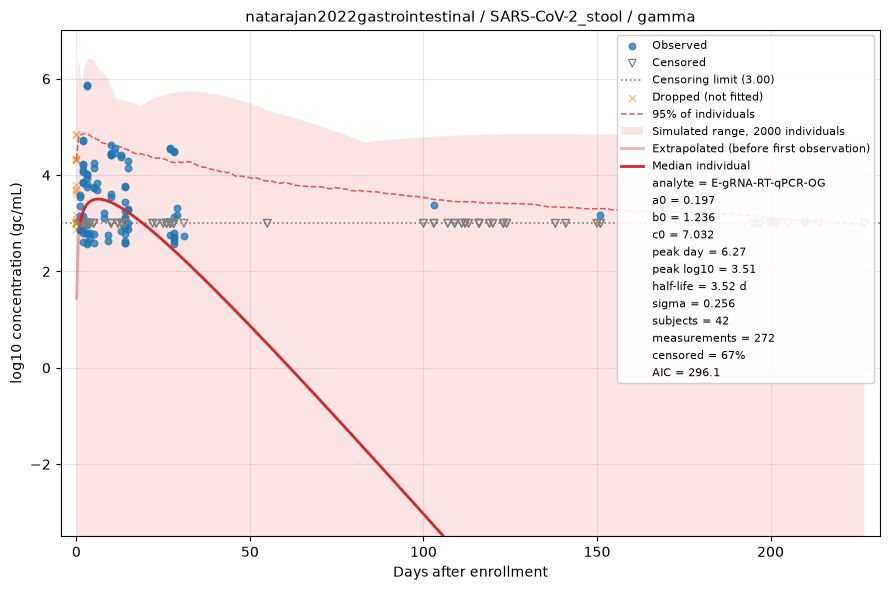
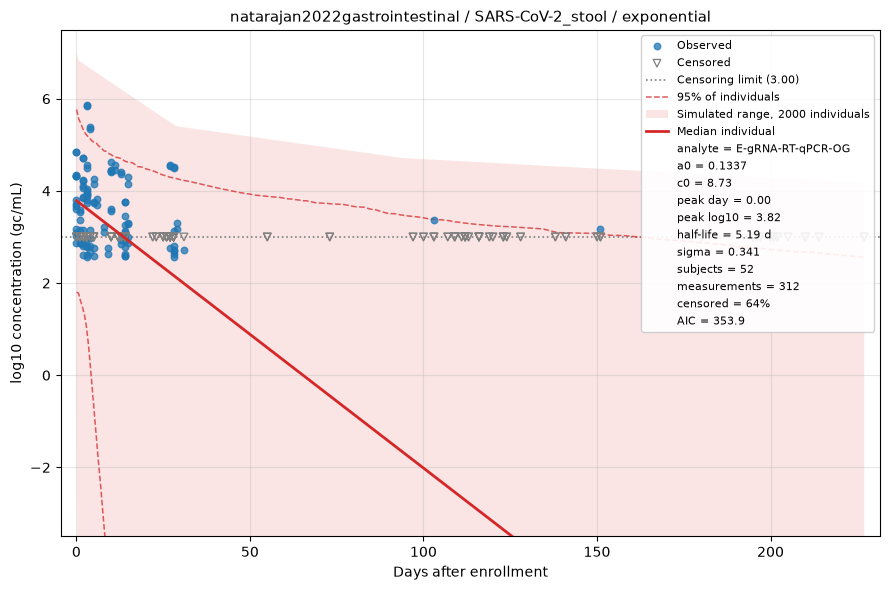
Fitted by censored maximum likelihood. The red line is the median individual; the shaded region is the full range of a simulated cohort drawn from the fitted population, so it shows what simulating from this dataset would produce rather than a confidence interval, with dashed lines at the central 95%. Open triangles are non-detects, drawn at the censoring limit and entering the fit as "below this value" rather than being dropped. See the modelling methods for what these estimates do and do not support.
E-gRNA-RT-qPCR-ZY
Concentration of genomic RNA of the E gene quantified using RT-qPCR for a sample collected using the Zymo DNA/RNA shield fecal collection tube.
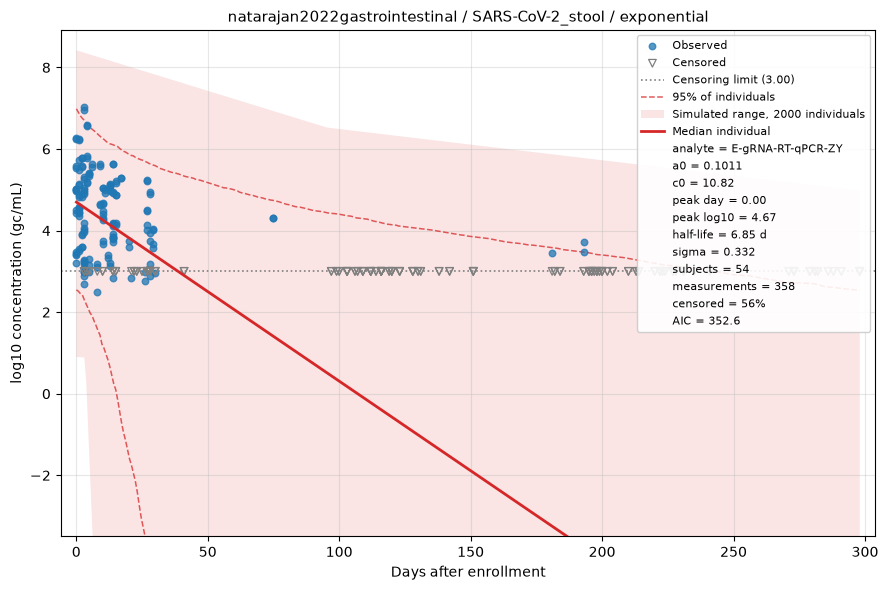
Fitted by censored maximum likelihood. The red line is the median individual; the shaded region is the full range of a simulated cohort drawn from the fitted population, so it shows what simulating from this dataset would produce rather than a confidence interval, with dashed lines at the central 95%. Open triangles are non-detects, drawn at the censoring limit and entering the fit as "below this value" rather than being dropped. See the modelling methods for what these estimates do and do not support.
RdRP-gRNA-RT-qPCR-OG
Concentration of genomic RNA of the RdRp gene quantified using RT-qPCR for a sample collected using the OMNIGene GUT collection tube.
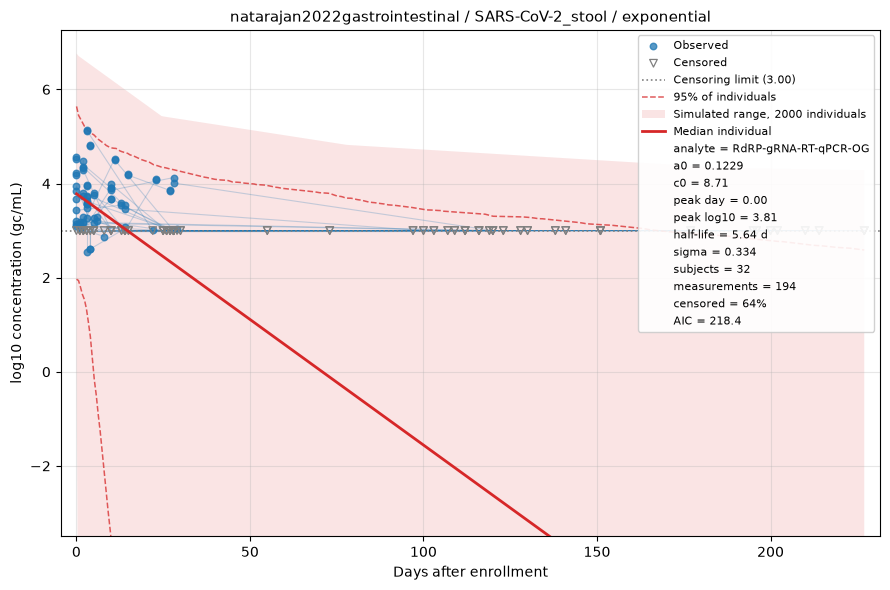
Fitted by censored maximum likelihood. The red line is the median individual; the shaded region is the full range of a simulated cohort drawn from the fitted population, so it shows what simulating from this dataset would produce rather than a confidence interval, with dashed lines at the central 95%. Open triangles are non-detects, drawn at the censoring limit and entering the fit as "below this value" rather than being dropped. See the modelling methods for what these estimates do and do not support.
RdRP-gRNA-RT-qPCR-ZY
Concentration of genomic RNA of the RdRp gene quantified using RT-qPCR for a sample collected using the Zymo DNA/RNA shield fecal collection tube.
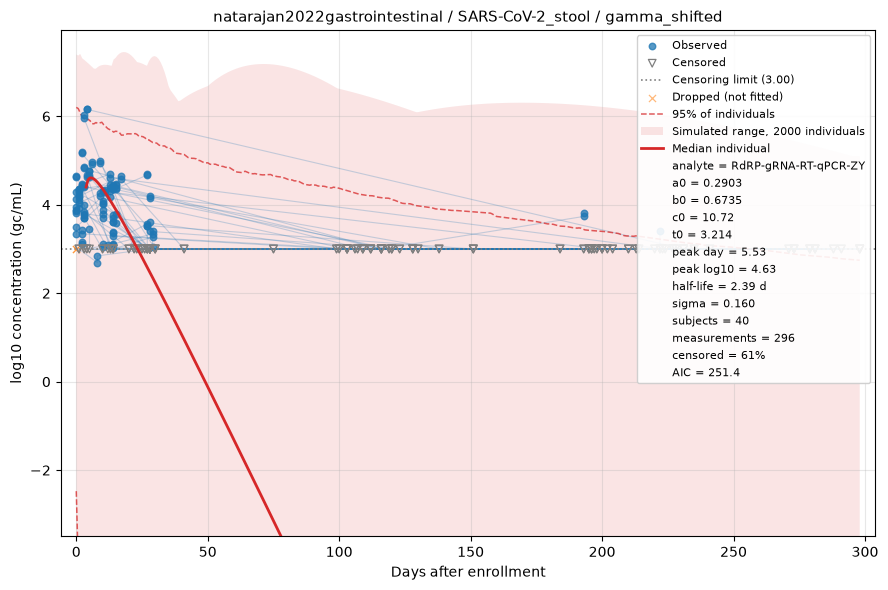
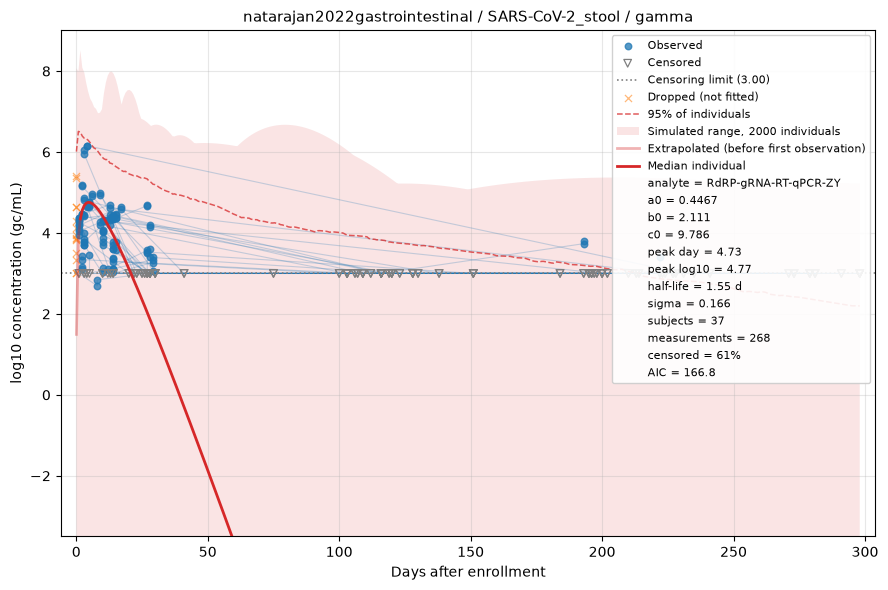
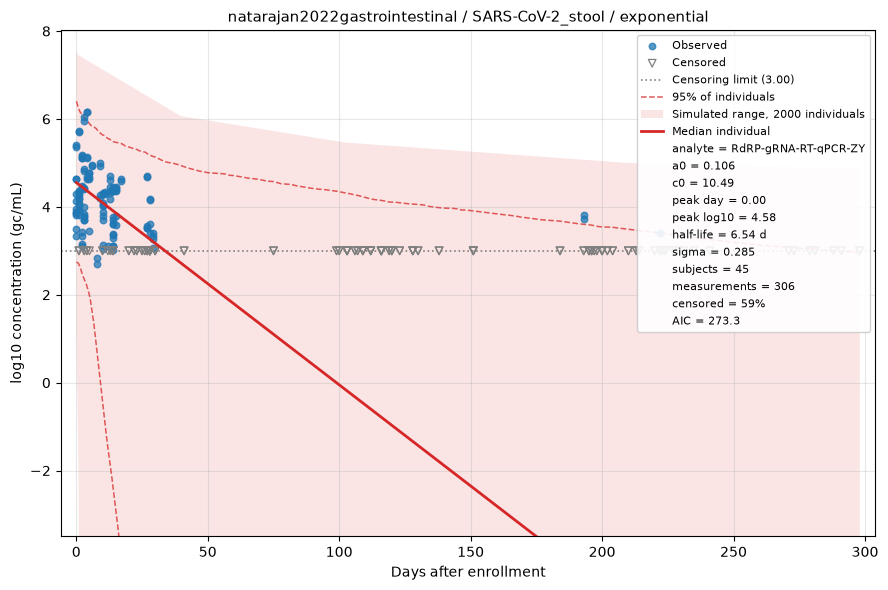
Fitted by censored maximum likelihood. The red line is the median individual; the shaded region is the full range of a simulated cohort drawn from the fitted population, so it shows what simulating from this dataset would produce rather than a confidence interval, with dashed lines at the central 95%. Open triangles are non-detects, drawn at the censoring limit and entering the fit as "below this value" rather than being dropped. See the modelling methods for what these estimates do and do not support.
N1-gRNA-RT-qPCR-OG
Concentration of genomic RNA of the N1 gene quantified using RT-qPCR for a sample collected using the OMNIGene GUT collection tube.
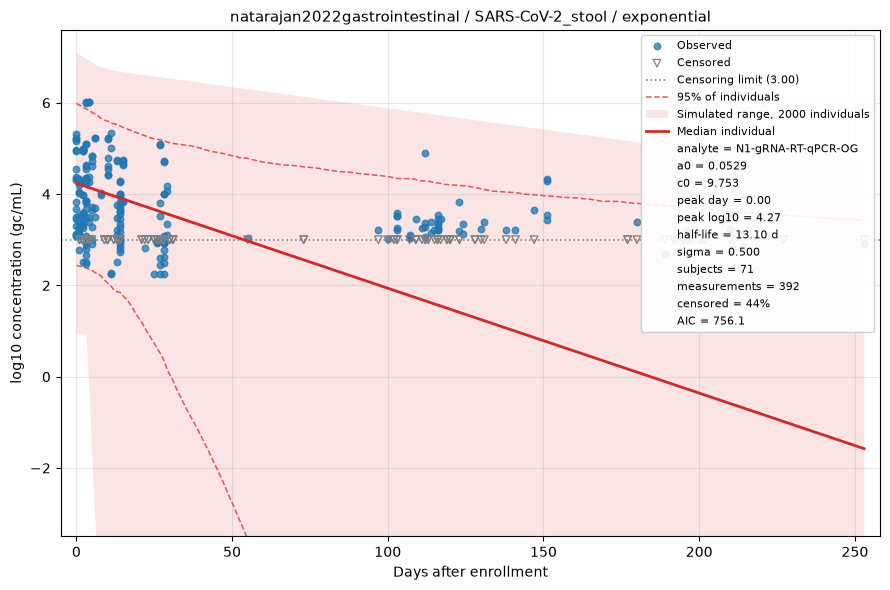
Fitted by censored maximum likelihood. The red line is the median individual; the shaded region is the full range of a simulated cohort drawn from the fitted population, so it shows what simulating from this dataset would produce rather than a confidence interval, with dashed lines at the central 95%. Open triangles are non-detects, drawn at the censoring limit and entering the fit as "below this value" rather than being dropped. See the modelling methods for what these estimates do and do not support.
N1-gRNA-RT-qPCR-ZY
Concentration of genomic RNA of the N1 gene quantified using RT-qPCR for a sample collected using the Zymo DNA/RNA shield fecal collection tube.
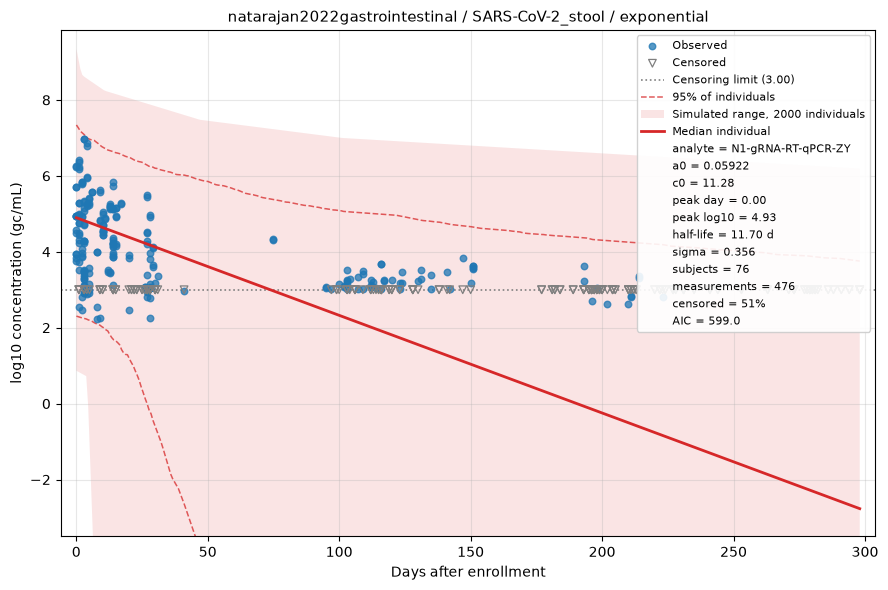
Fitted by censored maximum likelihood. The red line is the median individual; the shaded region is the full range of a simulated cohort drawn from the fitted population, so it shows what simulating from this dataset would produce rather than a confidence interval, with dashed lines at the central 95%. Open triangles are non-detects, drawn at the censoring limit and entering the fit as "below this value" rather than being dropped. See the modelling methods for what these estimates do and do not support.
N2-gRNA-RT-qPCR-OG
Concentration of genomic RNA of the N2 gene quantified using RT-qPCR for a sample collected using the OMNIGene GUT collection tube.
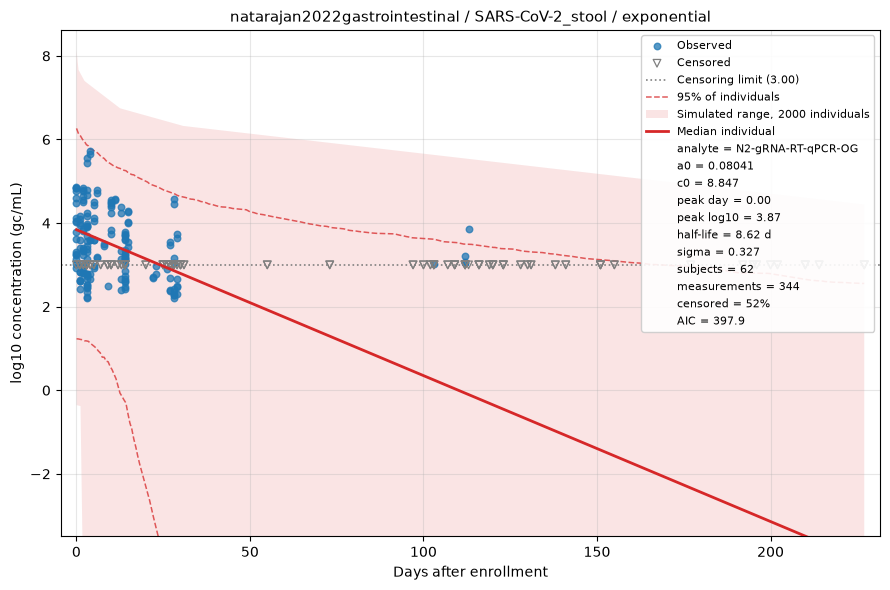
Fitted by censored maximum likelihood. The red line is the median individual; the shaded region is the full range of a simulated cohort drawn from the fitted population, so it shows what simulating from this dataset would produce rather than a confidence interval, with dashed lines at the central 95%. Open triangles are non-detects, drawn at the censoring limit and entering the fit as "below this value" rather than being dropped. See the modelling methods for what these estimates do and do not support.
N2-gRNA-RT-qPCR-ZY
Concentration of genomic RNA of the N2 gene quantified using RT-qPCR for a sample collected using the Zymo DNA/RNA shield fecal collection tube.
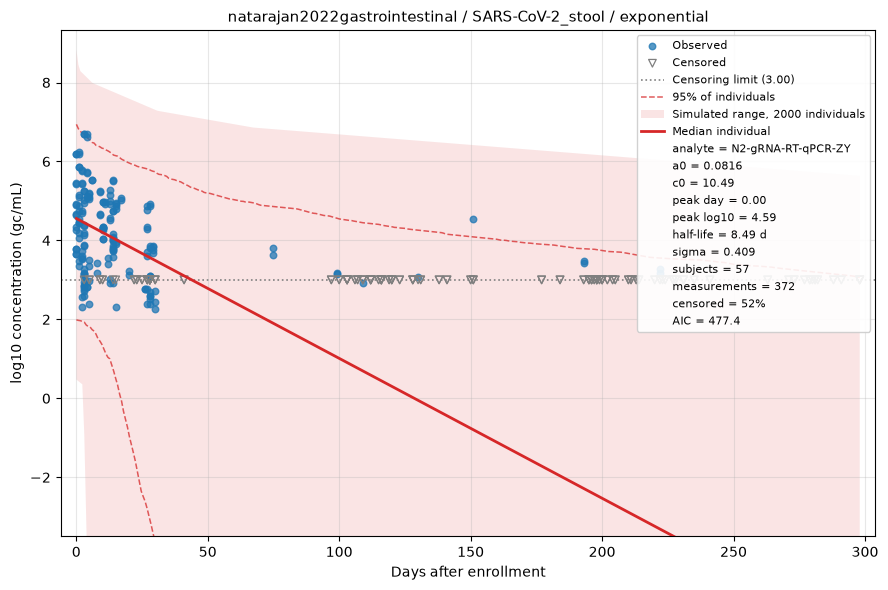
Fitted by censored maximum likelihood. The red line is the median individual; the shaded region is the full range of a simulated cohort drawn from the fitted population, so it shows what simulating from this dataset would produce rather than a confidence interval, with dashed lines at the central 95%. Open triangles are non-detects, drawn at the censoring limit and entering the fit as "below this value" rather than being dropped. See the modelling methods for what these estimates do and do not support.
N1-gRNA-ddPCR-OG
Concentration of genomic RNA of the N1 gene quantified using ddPCR for a sample collected using the OMNIGene GUT collection tube.
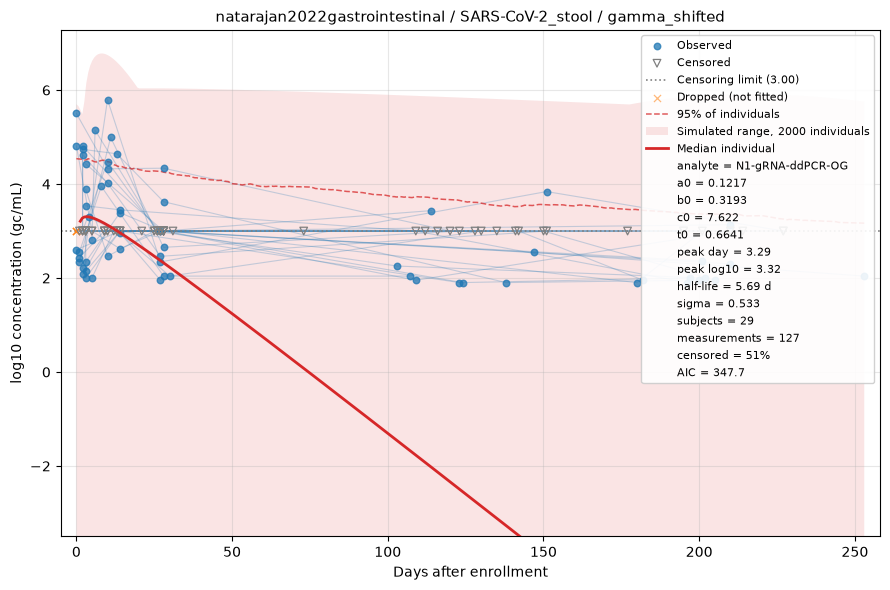
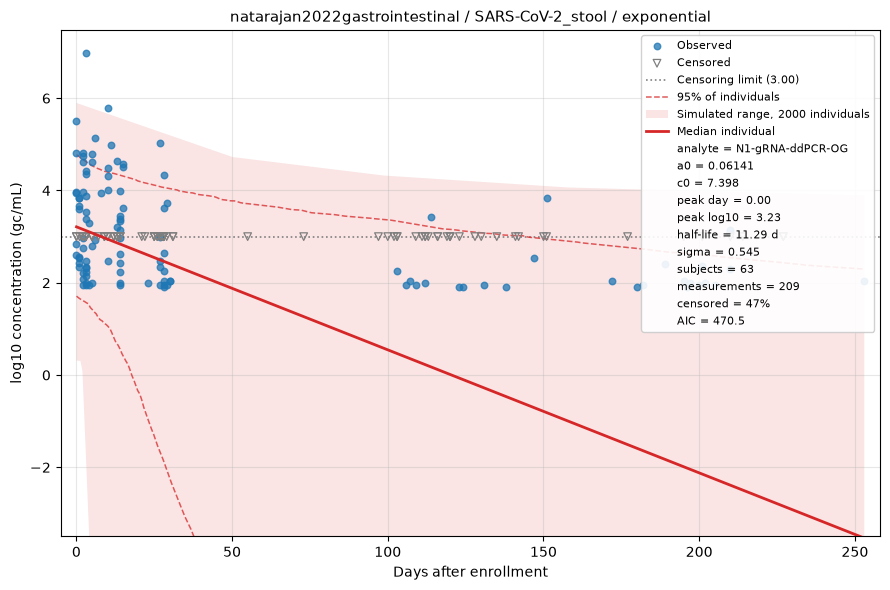
Fitted by censored maximum likelihood. The red line is the median individual; the shaded region is the full range of a simulated cohort drawn from the fitted population, so it shows what simulating from this dataset would produce rather than a confidence interval, with dashed lines at the central 95%. Open triangles are non-detects, drawn at the censoring limit and entering the fit as "below this value" rather than being dropped. See the modelling methods for what these estimates do and do not support.
N1-gRNA-ddPCR-ZY
Concentration of genomic RNA of the N1 gene quantified using ddPCR for a sample collected using the Zymo DNA/RNA shield fecal collection tube.
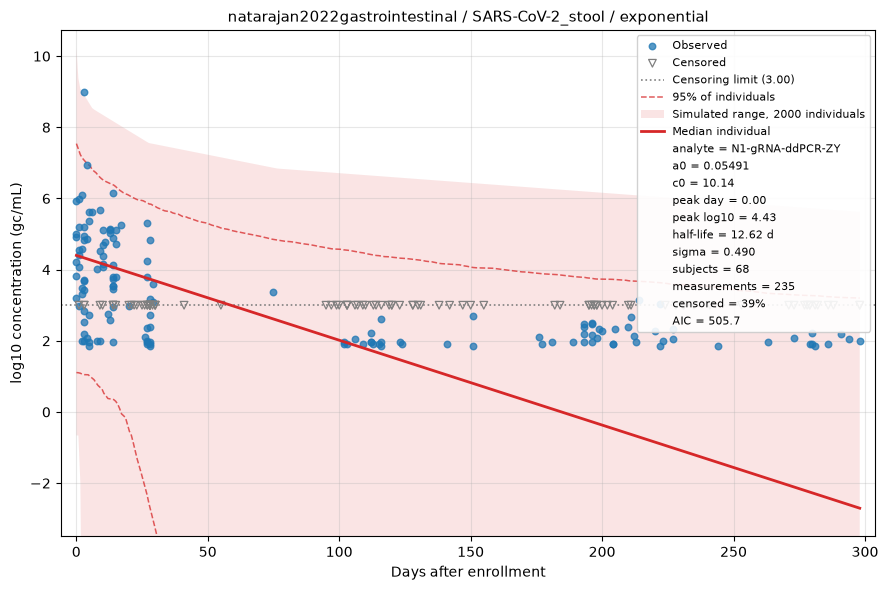
Fitted by censored maximum likelihood. The red line is the median individual; the shaded region is the full range of a simulated cohort drawn from the fitted population, so it shows what simulating from this dataset would produce rather than a confidence interval, with dashed lines at the central 95%. Open triangles are non-detects, drawn at the censoring limit and entering the fit as "below this value" rather than being dropped. See the modelling methods for what these estimates do and do not support.
E-gRNA-ddPCR-OG
Concentration of genomic RNA of the E gene quantified using ddPCR for a sample collected using the OMNIGene GUT collection tube.
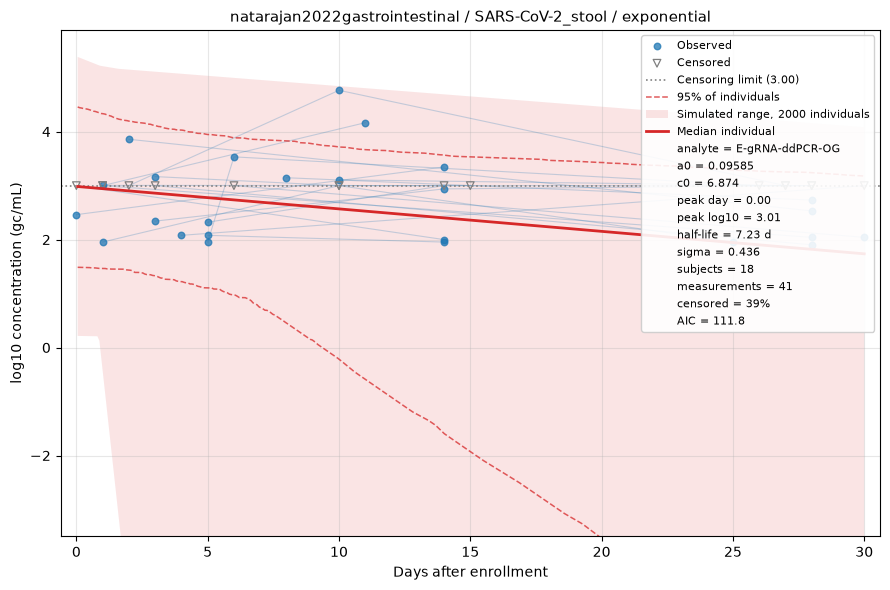
Fitted by censored maximum likelihood. The red line is the median individual; the shaded region is the full range of a simulated cohort drawn from the fitted population, so it shows what simulating from this dataset would produce rather than a confidence interval, with dashed lines at the central 95%. Open triangles are non-detects, drawn at the censoring limit and entering the fit as "below this value" rather than being dropped. See the modelling methods for what these estimates do and do not support.
E-gRNA-ddPCR-ZY
Concentration of genomic RNA of the E gene quantified using ddPCR for a sample collected using the Zymo DNA/RNA shield fecal collection tube.
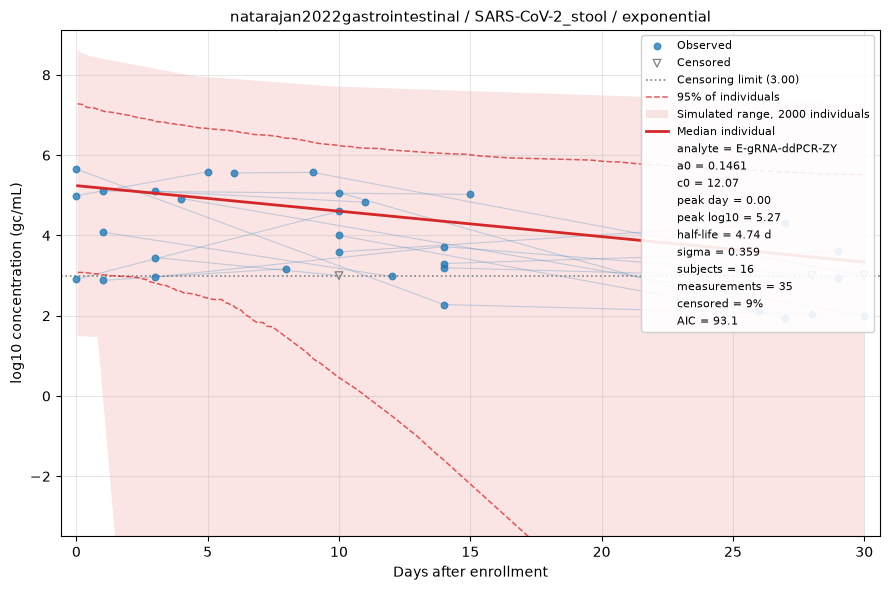
Fitted by censored maximum likelihood. The red line is the median individual; the shaded region is the full range of a simulated cohort drawn from the fitted population, so it shows what simulating from this dataset would produce rather than a confidence interval, with dashed lines at the central 95%. Open triangles are non-detects, drawn at the censoring limit and entering the fit as "below this value" rather than being dropped. See the modelling methods for what these estimates do and do not support.
N1-sgRNA-RT-qPCR-OG
Concentration of sub-genomic RNA of the N1 gene quantified using RT-qPCR for a sample collected using the OMNIGene GUT collection tube.
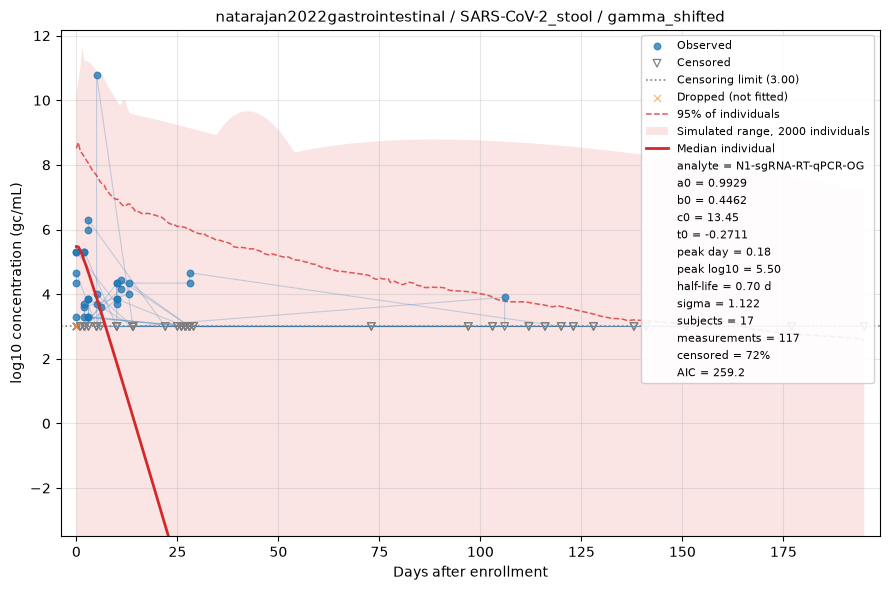
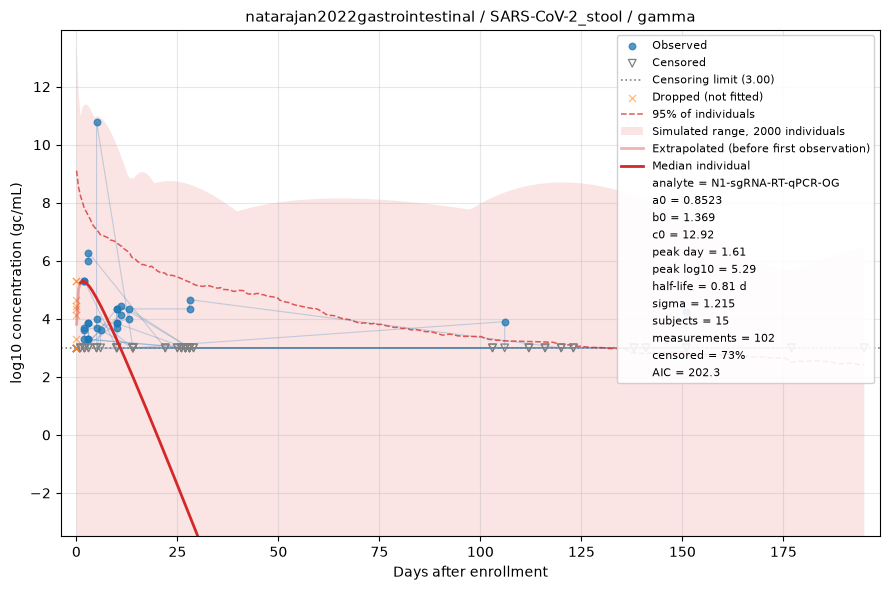
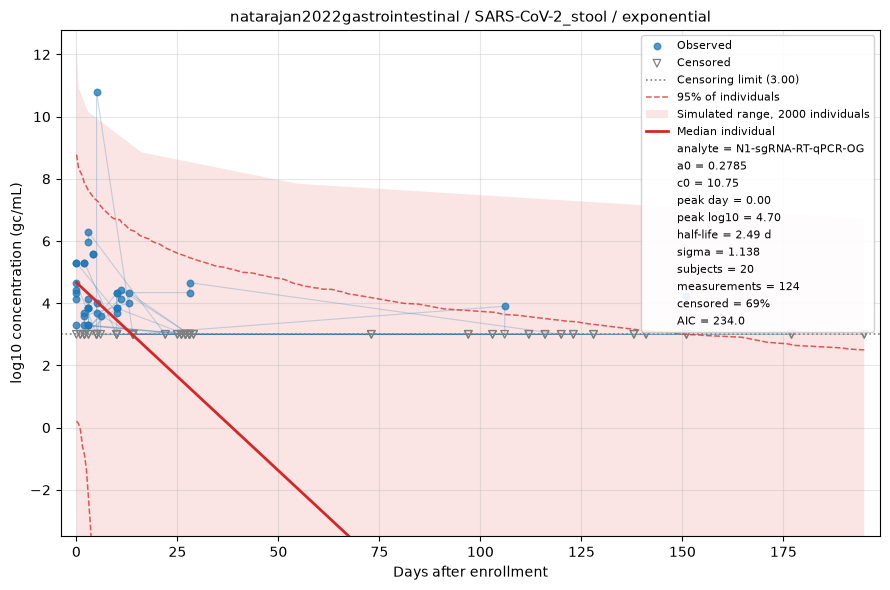
Fitted by censored maximum likelihood. The red line is the median individual; the shaded region is the full range of a simulated cohort drawn from the fitted population, so it shows what simulating from this dataset would produce rather than a confidence interval, with dashed lines at the central 95%. Open triangles are non-detects, drawn at the censoring limit and entering the fit as "below this value" rather than being dropped. See the modelling methods for what these estimates do and do not support.
N1-sgRNA-RT-qPCR-ZY
Concentration of sub-genomic RNA of the N1 gene quantified using RT-qPCR for a sample collected using the Zymo DNA/RNA shield fecal collection tube.
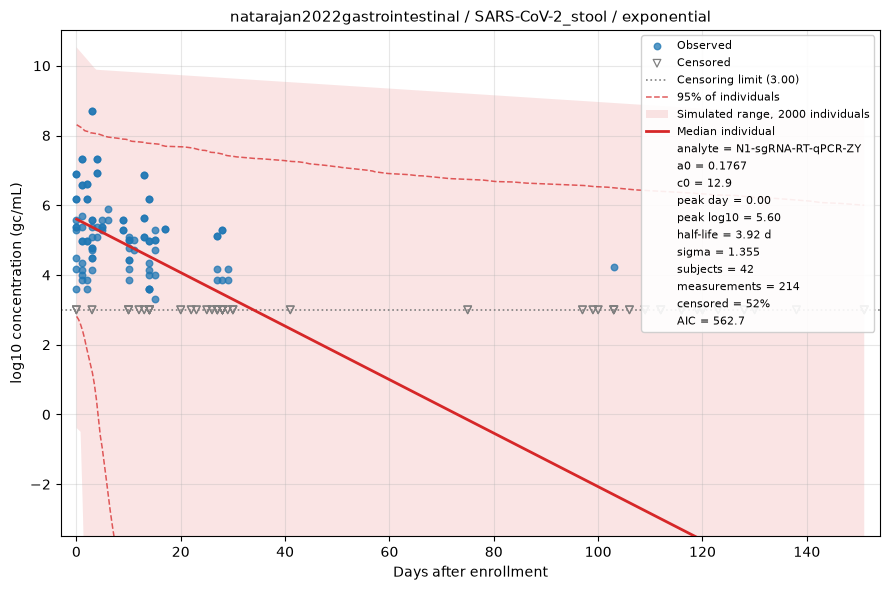
Fitted by censored maximum likelihood. The red line is the median individual; the shaded region is the full range of a simulated cohort drawn from the fitted population, so it shows what simulating from this dataset would produce rather than a confidence interval, with dashed lines at the central 95%. Open triangles are non-detects, drawn at the censoring limit and entering the fit as "below this value" rather than being dropped. See the modelling methods for what these estimates do and do not support.