Dose-dependent efficacy of intravenous brincidofovir across adenovirus species in immunocompromised patients lucini2026dose
Phase 2a ATHENA trial in immunocompromised patients with invasive human adenovirus (HAdV) infection treated with intravenous brincidofovir (BCV) in four dosing cohorts. The study monitored adenovirus in blood (serum/plasma) and stool using species-specific qPCR (screening and typing) and next-generation sequencing (NGS) for genotype identification, assessing virological responses and documenting species/genotype diversity including mixed infections. Patients in cohort 1 treated with intravenous BCV at a dose of 0.2 mg/kg twice weekly (BIW). Patients in cohorts 2 treated with 0.3 mg/kg BIW. Patients in cohort 3 treated with 0.4 mg/kg BIW. The only patient where a serum sample was available treated with 0.4 mg/kg once weekly.
Analytes
serum_a
Quantitative adenovirus DNA load in serum measured by a two-step species-specific real-time qPCR approach (screening primers/probes for A/F/C and B/D/E followed by species-specific assays A–F), with viral loads calculated as copies per mL of serum; hexon gene targeted (primer/probe sets reported in supplement).
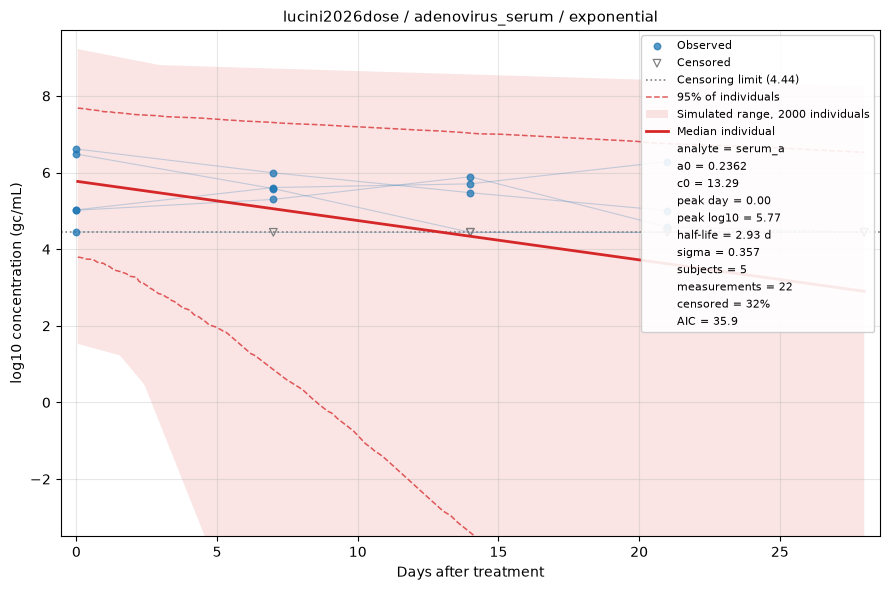
Fitted by censored maximum likelihood. The red line is the median individual; the shaded region is the full range of a simulated cohort drawn from the fitted population, so it shows what simulating from this dataset would produce rather than a confidence interval, with dashed lines at the central 95%. Open triangles are non-detects, drawn at the censoring limit and entering the fit as "below this value" rather than being dropped. See the modelling methods for what these estimates do and do not support.
serum_b
Quantitative adenovirus DNA load in serum measured by a two-step species-specific real-time qPCR approach (screening primers/probes for A/F/C and B/D/E followed by species-specific assays A–F), with viral loads calculated as copies per mL of serum; hexon gene targeted (primer/probe sets reported in supplement).
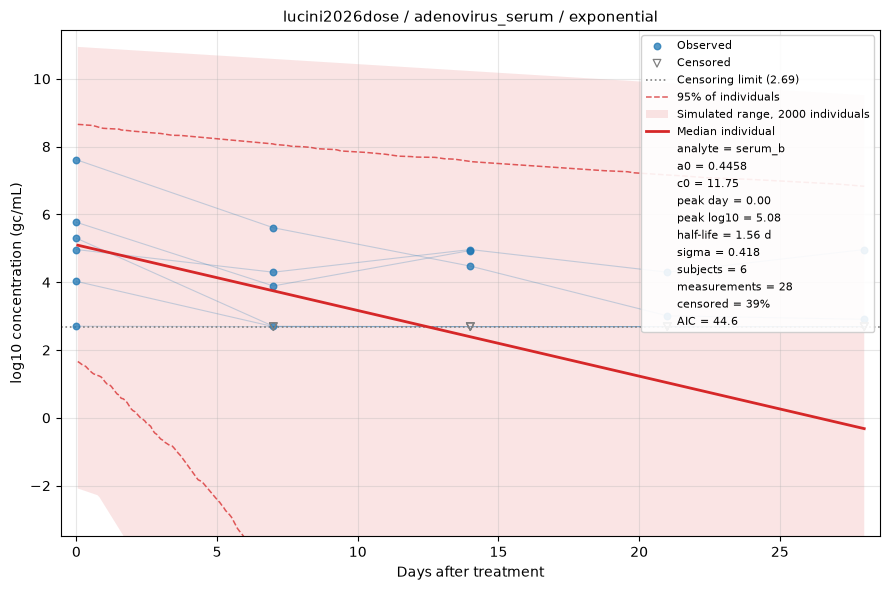
Fitted by censored maximum likelihood. The red line is the median individual; the shaded region is the full range of a simulated cohort drawn from the fitted population, so it shows what simulating from this dataset would produce rather than a confidence interval, with dashed lines at the central 95%. Open triangles are non-detects, drawn at the censoring limit and entering the fit as "below this value" rather than being dropped. See the modelling methods for what these estimates do and do not support.
serum_c
Quantitative adenovirus DNA load in serum measured by a two-step species-specific real-time qPCR approach (screening primers/probes for A/F/C and B/D/E followed by species-specific assays A–F), with viral loads calculated as copies per mL of serum; hexon gene targeted (primer/probe sets reported in supplement).
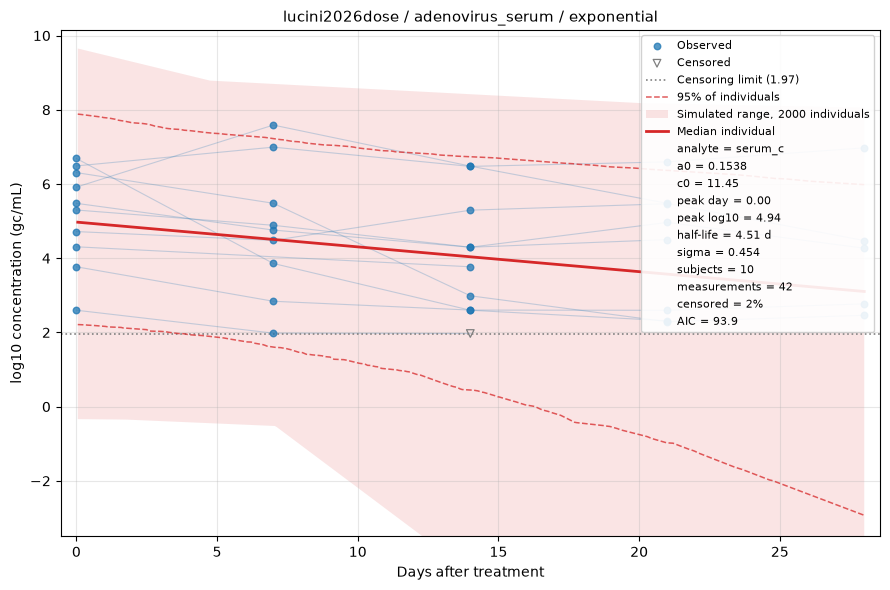
Fitted by censored maximum likelihood. The red line is the median individual; the shaded region is the full range of a simulated cohort drawn from the fitted population, so it shows what simulating from this dataset would produce rather than a confidence interval, with dashed lines at the central 95%. Open triangles are non-detects, drawn at the censoring limit and entering the fit as "below this value" rather than being dropped. See the modelling methods for what these estimates do and do not support.
serum_e
Quantitative adenovirus DNA load in serum measured by a two-step species-specific real-time qPCR approach (screening primers/probes for A/F/C and B/D/E followed by species-specific assays A–F), with viral loads calculated as copies per mL of serum; hexon gene targeted (primer/probe sets reported in supplement).
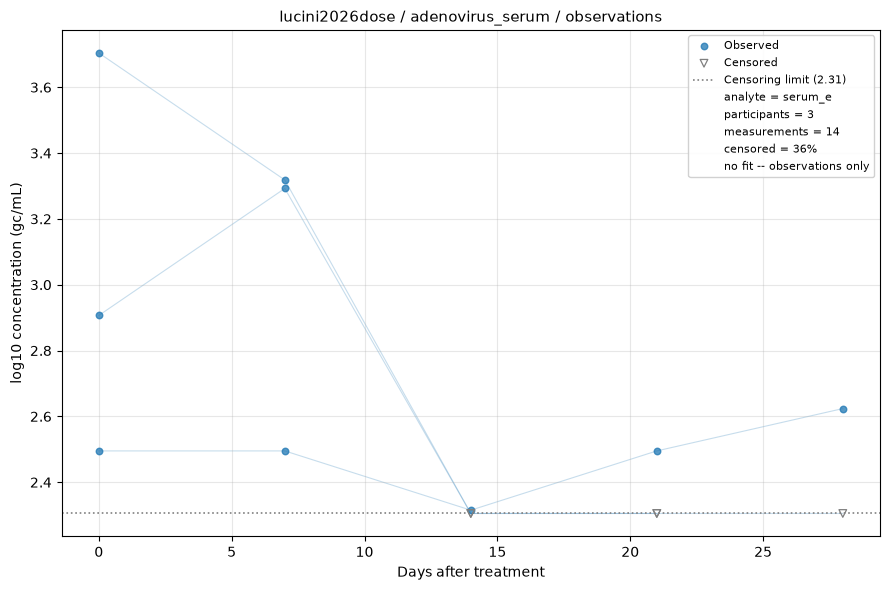
Measurements only — no shedding model is fitted to this analyte, usually because it is sampled once per participant, leaving no trajectory to fit, or because nothing was ever detected. Open triangles are non-detects, drawn at the assay's censoring limit. See the modelling methods for what these estimates do and do not support.
serum_f
Quantitative adenovirus DNA load in serum measured by a two-step species-specific real-time qPCR approach (screening primers/probes for A/F/C and B/D/E followed by species-specific assays A–F), with viral loads calculated as copies per mL of serum; hexon gene targeted (primer/probe sets reported in supplement).
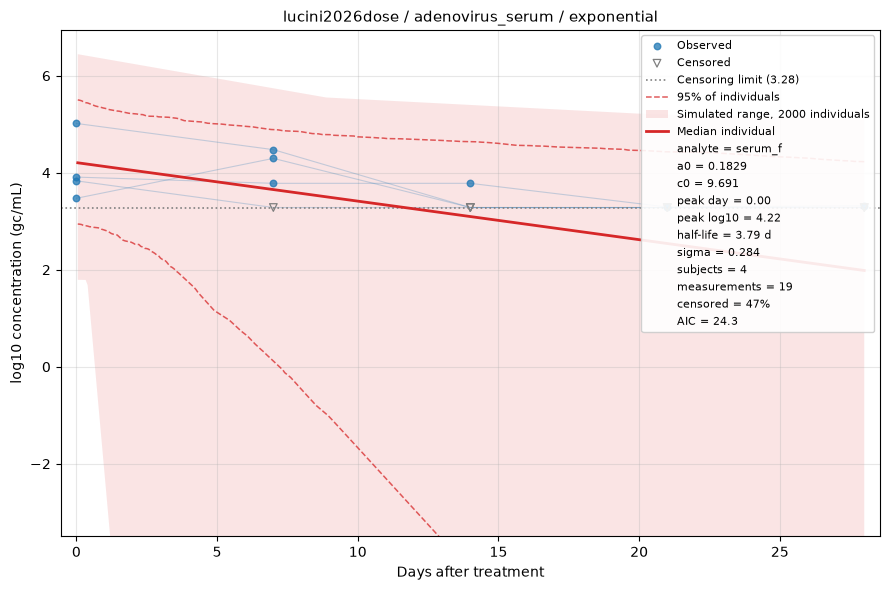
Fitted by censored maximum likelihood. The red line is the median individual; the shaded region is the full range of a simulated cohort drawn from the fitted population, so it shows what simulating from this dataset would produce rather than a confidence interval, with dashed lines at the central 95%. Open triangles are non-detects, drawn at the censoring limit and entering the fit as "below this value" rather than being dropped. See the modelling methods for what these estimates do and do not support.
stool_a
Quantitative adenovirus DNA load in stool measured by a two-step species-specific real-time qPCR approach (screening primers/probes for A/F/C and B/D/E followed by species-specific assays A–F), with viral loads calculated as copies per gram of stool; hexon gene targeted (primer/probe sets reported in supplement).
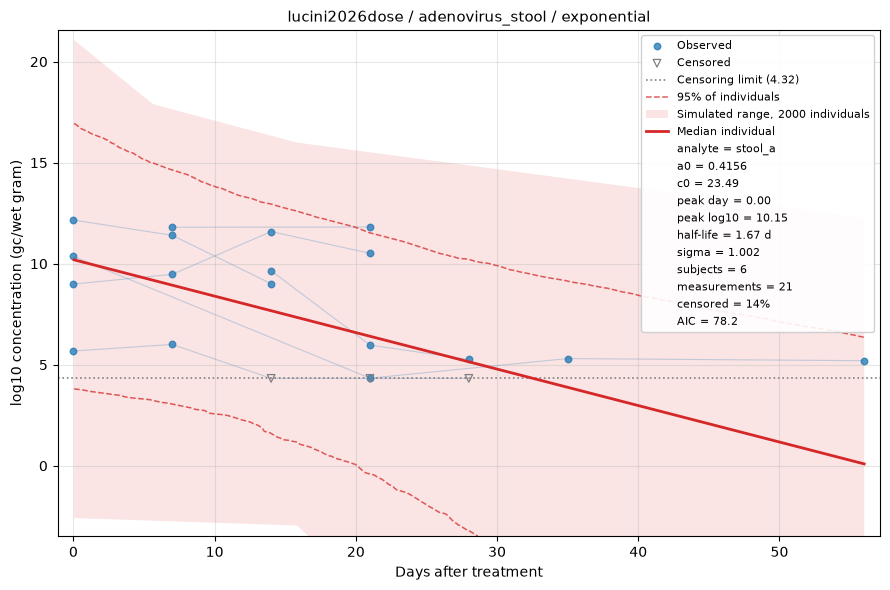
Fitted by censored maximum likelihood. The red line is the median individual; the shaded region is the full range of a simulated cohort drawn from the fitted population, so it shows what simulating from this dataset would produce rather than a confidence interval, with dashed lines at the central 95%. Open triangles are non-detects, drawn at the censoring limit and entering the fit as "below this value" rather than being dropped. See the modelling methods for what these estimates do and do not support.
stool_b
Quantitative adenovirus DNA load in stool measured by a two-step species-specific real-time qPCR approach (screening primers/probes for A/F/C and B/D/E followed by species-specific assays A–F), with viral loads calculated as copies per gram of stool; hexon gene targeted (primer/probe sets reported in supplement).
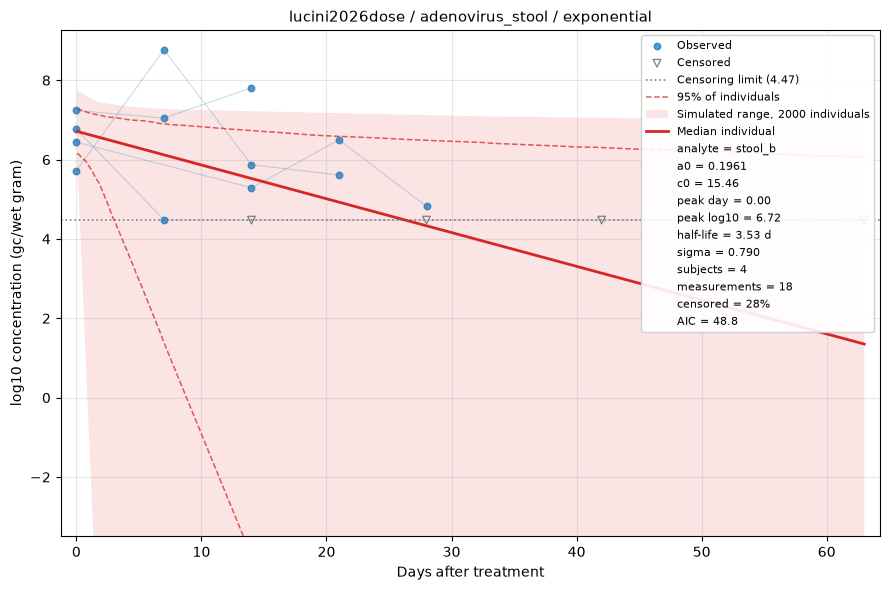
Fitted by censored maximum likelihood. The red line is the median individual; the shaded region is the full range of a simulated cohort drawn from the fitted population, so it shows what simulating from this dataset would produce rather than a confidence interval, with dashed lines at the central 95%. Open triangles are non-detects, drawn at the censoring limit and entering the fit as "below this value" rather than being dropped. See the modelling methods for what these estimates do and do not support.
stool_c
Quantitative adenovirus DNA load in stool measured by a two-step species-specific real-time qPCR approach (screening primers/probes for A/F/C and B/D/E followed by species-specific assays A–F), with viral loads calculated as copies per gram of stool; hexon gene targeted (primer/probe sets reported in supplement).
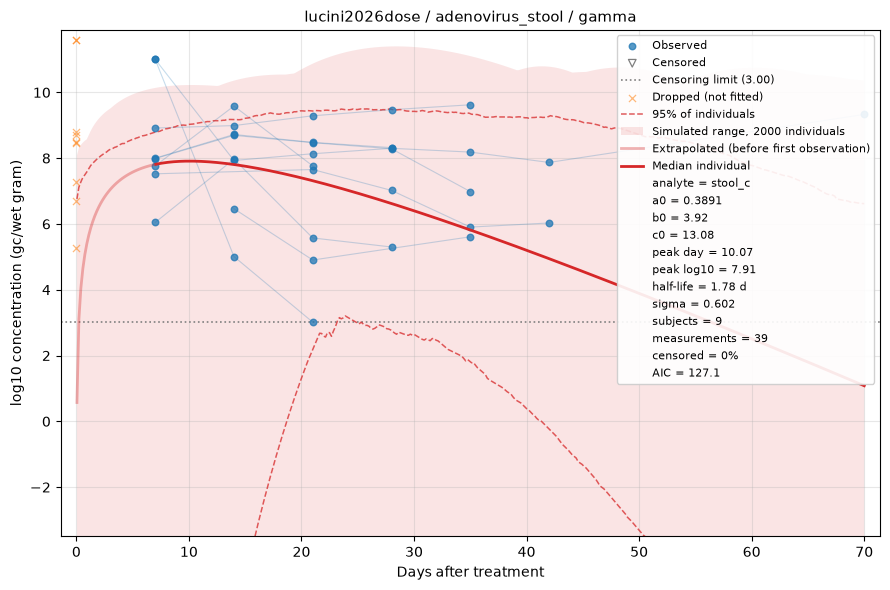
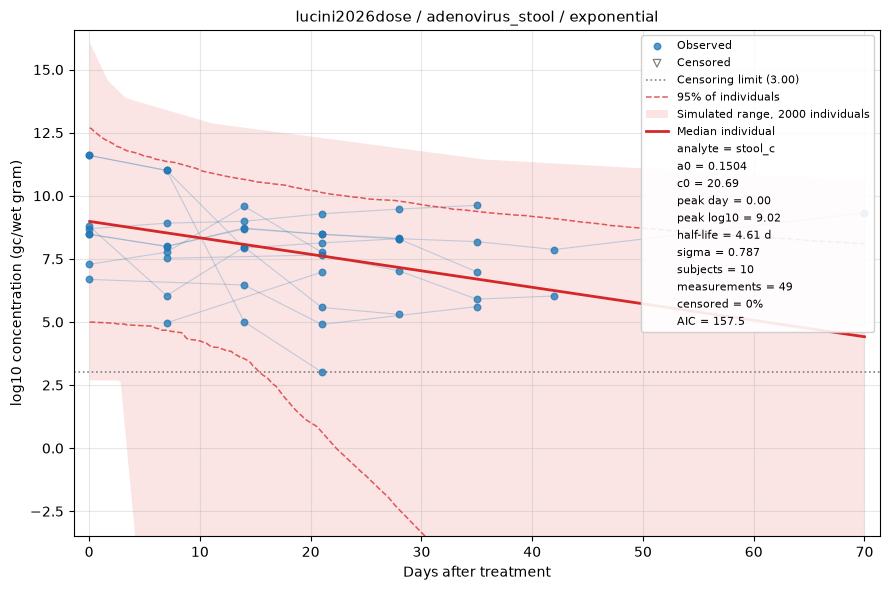
Fitted by censored maximum likelihood. The red line is the median individual; the shaded region is the full range of a simulated cohort drawn from the fitted population, so it shows what simulating from this dataset would produce rather than a confidence interval, with dashed lines at the central 95%. Open triangles are non-detects, drawn at the censoring limit and entering the fit as "below this value" rather than being dropped. See the modelling methods for what these estimates do and do not support.
stool_d
Quantitative adenovirus DNA load in stool measured by a two-step species-specific real-time qPCR approach (screening primers/probes for A/F/C and B/D/E followed by species-specific assays A–F), with viral loads calculated as copies per gram of stool; hexon gene targeted (primer/probe sets reported in supplement).
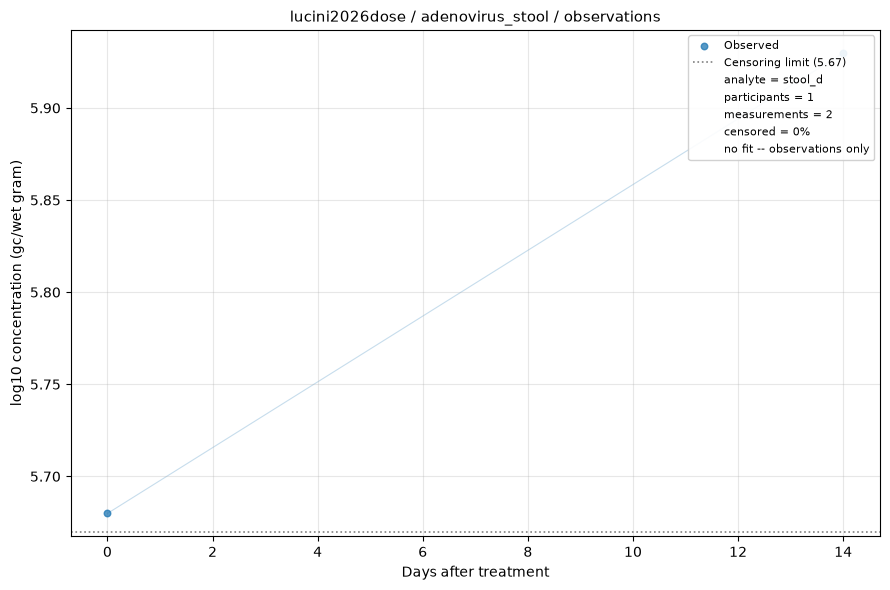
Measurements only — no shedding model is fitted to this analyte, usually because it is sampled once per participant, leaving no trajectory to fit, or because nothing was ever detected. Open triangles are non-detects, drawn at the assay's censoring limit. See the modelling methods for what these estimates do and do not support.
stool_e
Quantitative adenovirus DNA load in stool measured by a two-step species-specific real-time qPCR approach (screening primers/probes for A/F/C and B/D/E followed by species-specific assays A–F), with viral loads calculated as copies per gram of stool; hexon gene targeted (primer/probe sets reported in supplement).
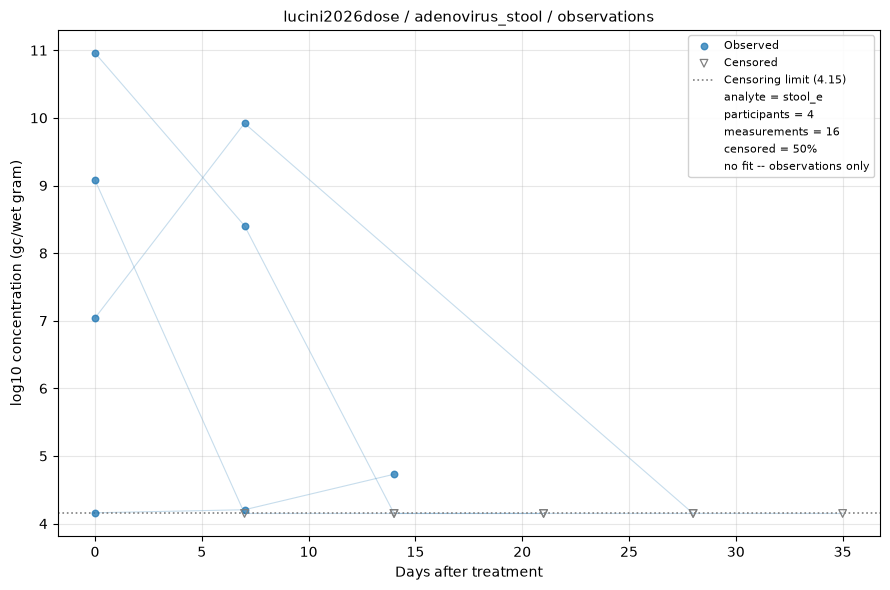
Measurements only — no shedding model is fitted to this analyte, usually because it is sampled once per participant, leaving no trajectory to fit, or because nothing was ever detected. Open triangles are non-detects, drawn at the assay's censoring limit. See the modelling methods for what these estimates do and do not support.
stool_f
Quantitative adenovirus DNA load in stool measured by a two-step species-specific real-time qPCR approach (screening primers/probes for A/F/C and B/D/E followed by species-specific assays A–F), with viral loads calculated as copies per gram of stool; hexon gene targeted (primer/probe sets reported in supplement).
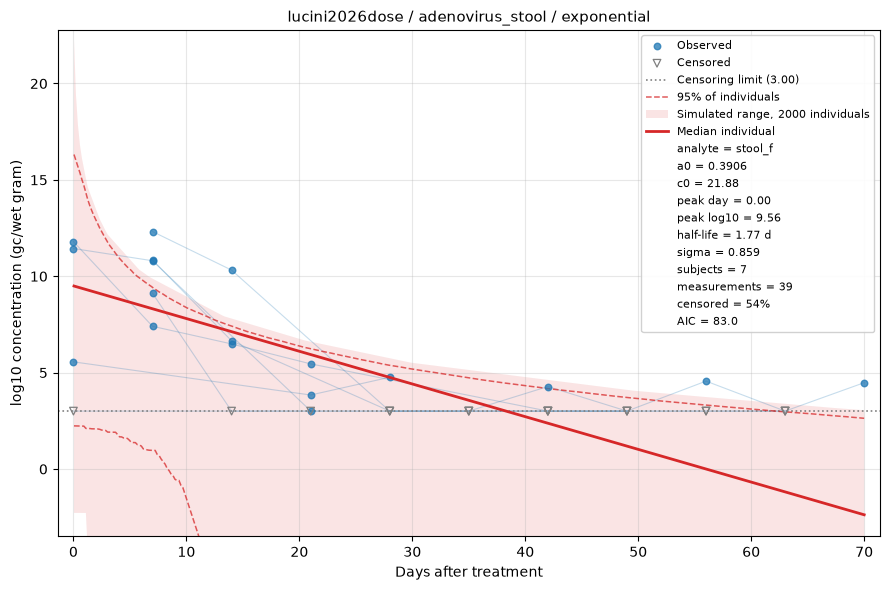
Fitted by censored maximum likelihood. The red line is the median individual; the shaded region is the full range of a simulated cohort drawn from the fitted population, so it shows what simulating from this dataset would produce rather than a confidence interval, with dashed lines at the central 95%. Open triangles are non-detects, drawn at the censoring limit and entering the fit as "below this value" rather than being dropped. See the modelling methods for what these estimates do and do not support.