Suppression of a SARS-CoV-2 outbreak in the Italian municipality of Vo lavezzo2020suppression
This study was conducted in the Italian municipality of Vo. Lockdown was implemented after first death of pneumonia was reported. Two surveys and virus tests were conducted with the first survey near the start of lockdown and the second one at the end of lockdown
Analytes
RdRp_first_pos
SARS-CoV-2 RNA genome copy concentration calculated from evaluation of RdRp gene, and the reference event is first positive day.
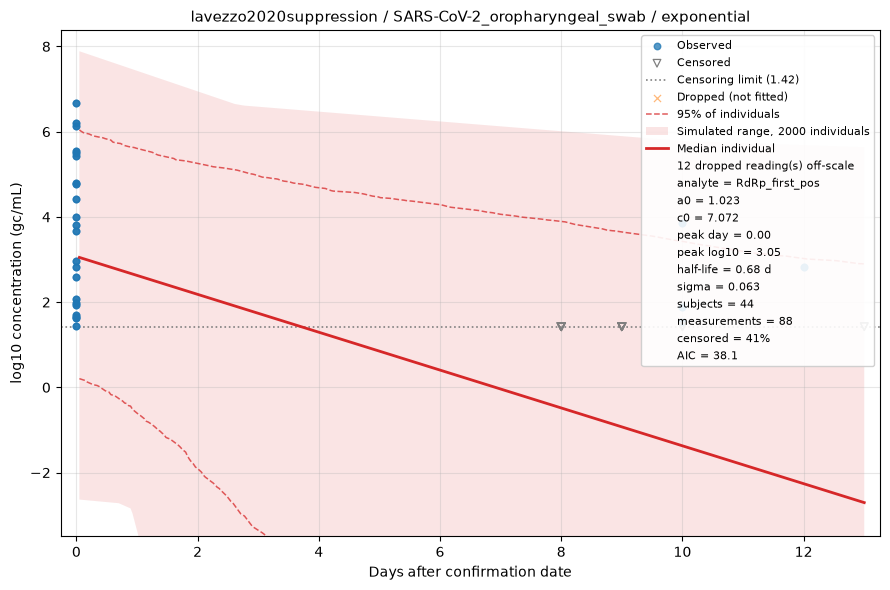
Fitted by censored maximum likelihood. The red line is the median individual; the shaded region is the full range of a simulated cohort drawn from the fitted population, so it shows what simulating from this dataset would produce rather than a confidence interval, with dashed lines at the central 95%. Open triangles are non-detects, drawn at the censoring limit and entering the fit as "below this value" rather than being dropped. See the modelling methods for what these estimates do and do not support.
E_first_pos
SARS-CoV-2 RNA genome copy concentration calculated from evaluation of E gene, and the reference event is first positive day.
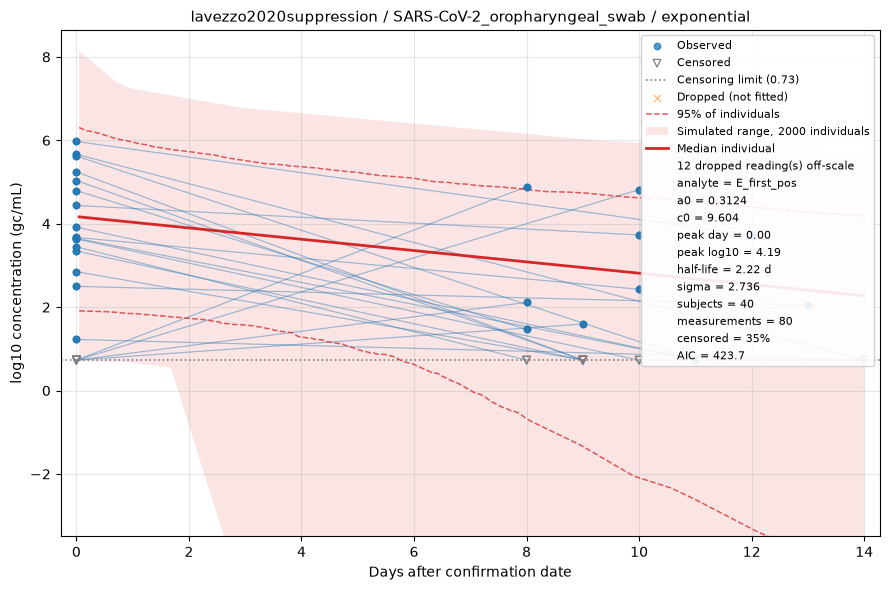
Fitted by censored maximum likelihood. The red line is the median individual; the shaded region is the full range of a simulated cohort drawn from the fitted population, so it shows what simulating from this dataset would produce rather than a confidence interval, with dashed lines at the central 95%. Open triangles are non-detects, drawn at the censoring limit and entering the fit as "below this value" rather than being dropped. See the modelling methods for what these estimates do and do not support.
RdRp_symptom
SARS-CoV-2 RNA genome copy concentration calculated from evaluation of RdRp gene, and the reference event is symptom onset day.
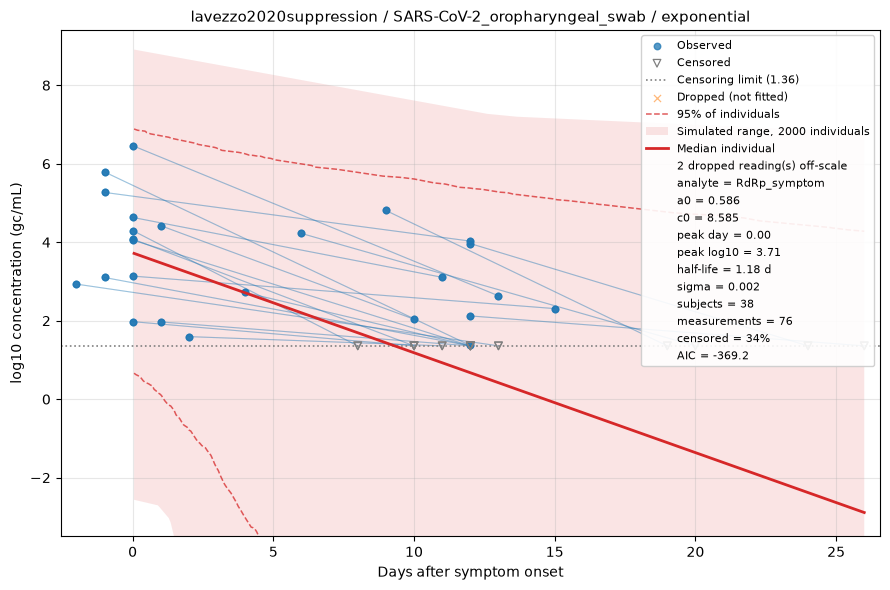
Fitted by censored maximum likelihood. The red line is the median individual; the shaded region is the full range of a simulated cohort drawn from the fitted population, so it shows what simulating from this dataset would produce rather than a confidence interval, with dashed lines at the central 95%. Open triangles are non-detects, drawn at the censoring limit and entering the fit as "below this value" rather than being dropped. See the modelling methods for what these estimates do and do not support.
E_symptom
SARS-CoV-2 RNA genome copy concentration calculated from evaluation of E gene, and the reference event is symptom onset day.
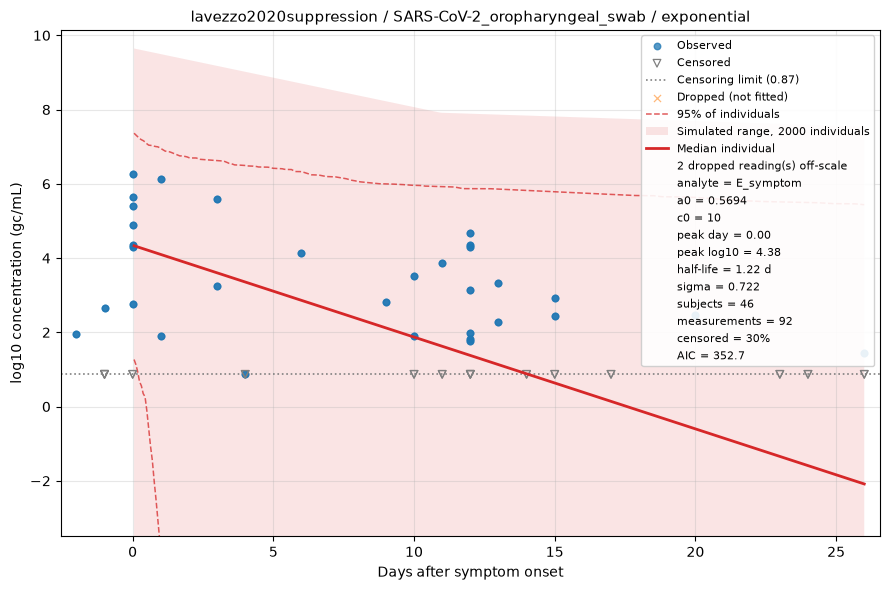
Fitted by censored maximum likelihood. The red line is the median individual; the shaded region is the full range of a simulated cohort drawn from the fitted population, so it shows what simulating from this dataset would produce rather than a confidence interval, with dashed lines at the central 95%. Open triangles are non-detects, drawn at the censoring limit and entering the fit as "below this value" rather than being dropped. See the modelling methods for what these estimates do and do not support.