Disease course and viral shedding in experimental Norwalk virus and Snow Mountain virus infection kirby2014disease
Human challenge study characterizing norovirus stool shedding kinetics following experimental inoculation with Norwalk virus (NV; GI.1) or Snow Mountain virus (SMV; GII.2). Viral stool titers were measured by quantitative real-time RT-PCR over time post-challenge (relative to inoculation); symptomatic status is recorded per participant.
Analytes
stool_norovirus_gc_wet_gram_gi
Quantitative real-time RT-PCR measurement of Norwalk virus (NV; norovirus genogroup GI) RNA concentration in stool. Values provided as gene copies per gram (wet weight).
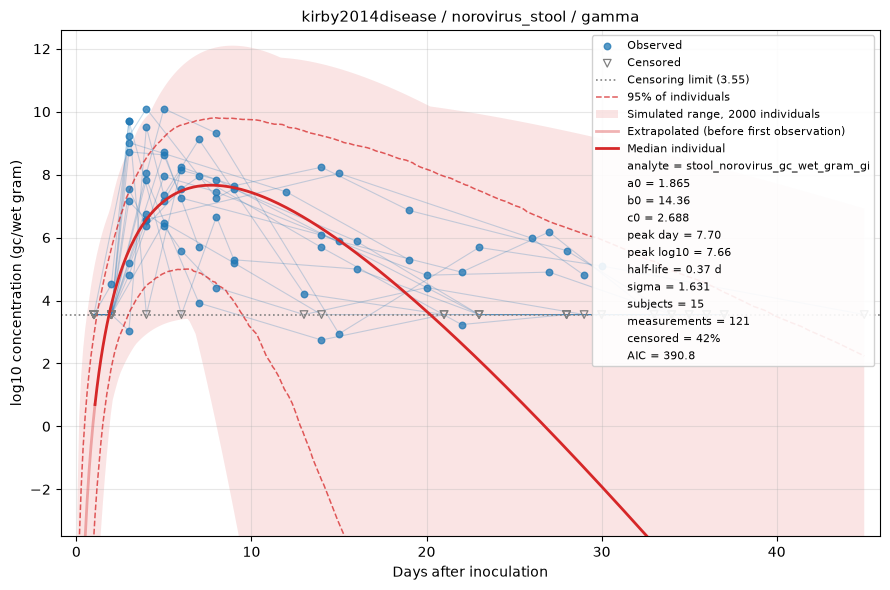
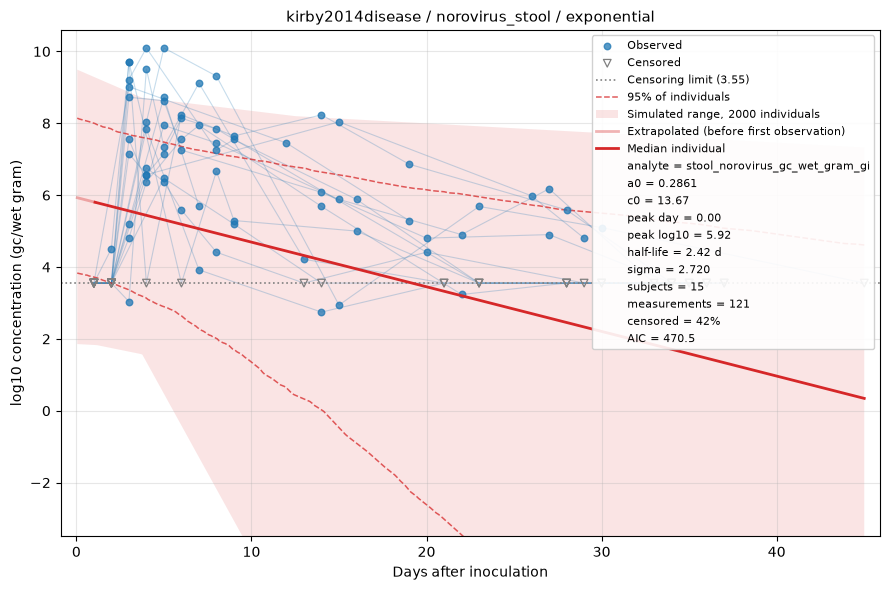
Fitted by censored maximum likelihood. The red line is the median individual; the shaded region is the full range of a simulated cohort drawn from the fitted population, so it shows what simulating from this dataset would produce rather than a confidence interval, with dashed lines at the central 95%. Open triangles are non-detects, drawn at the censoring limit and entering the fit as "below this value" rather than being dropped. See the modelling methods for what these estimates do and do not support.
stool_norovirus_gc_wet_gram_gii
Quantitative real-time RT-PCR measurement of Snow Mountain virus (SMV; norovirus genogroup GII) RNA concentration in stool. Values provided as gene copies per gram (wet weight).
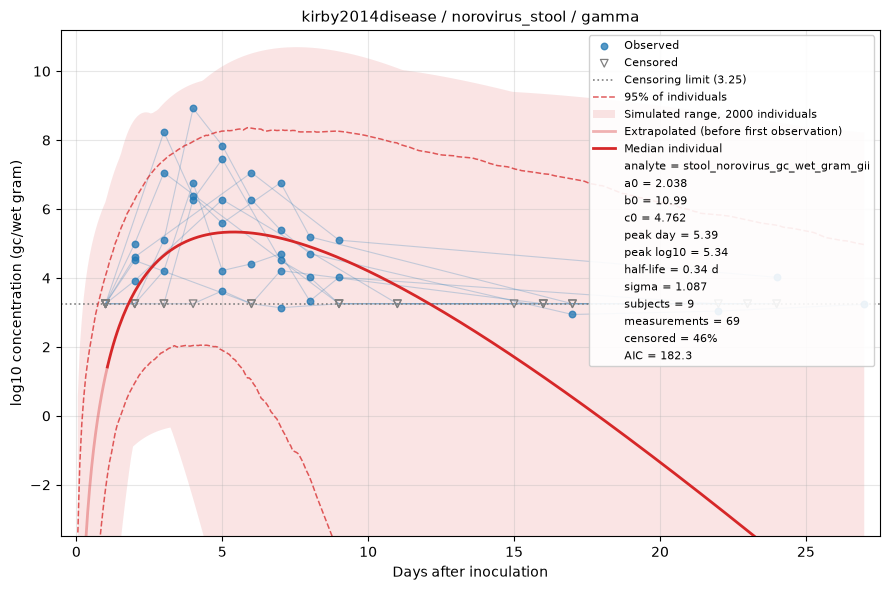
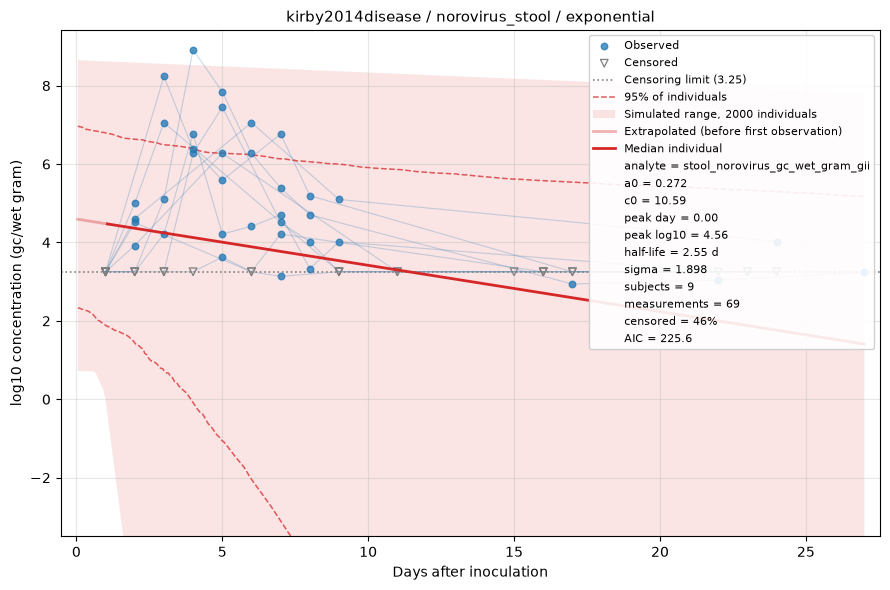
Fitted by censored maximum likelihood. The red line is the median individual; the shaded region is the full range of a simulated cohort drawn from the fitted population, so it shows what simulating from this dataset would produce rather than a confidence interval, with dashed lines at the central 95%. Open triangles are non-detects, drawn at the censoring limit and entering the fit as "below this value" rather than being dropped. See the modelling methods for what these estimates do and do not support.