Onset and window of SARS-CoV-2 infectiousness and temporal correlation with symptom onset: a prospective, longitudinal, community cohort study hakki2022onset
Through a prospective, longitudinal, community cohort study that captures the critical growth phase and peak of viral replication, the goal is to characterize the window of SARS-CoV-2 infectiousness and its temporal relationship with symptom onset.
Analytes
asymptomatic_PCR
This analyte represents the detection and quantification of SARS-CoV-2 viral RNA from throat and nose swabs specimens collected from asymptomatic participants. The analysis focuses on measuring the viral load expressed in log10 copies/mL, with the primary reference event being the enrollment.
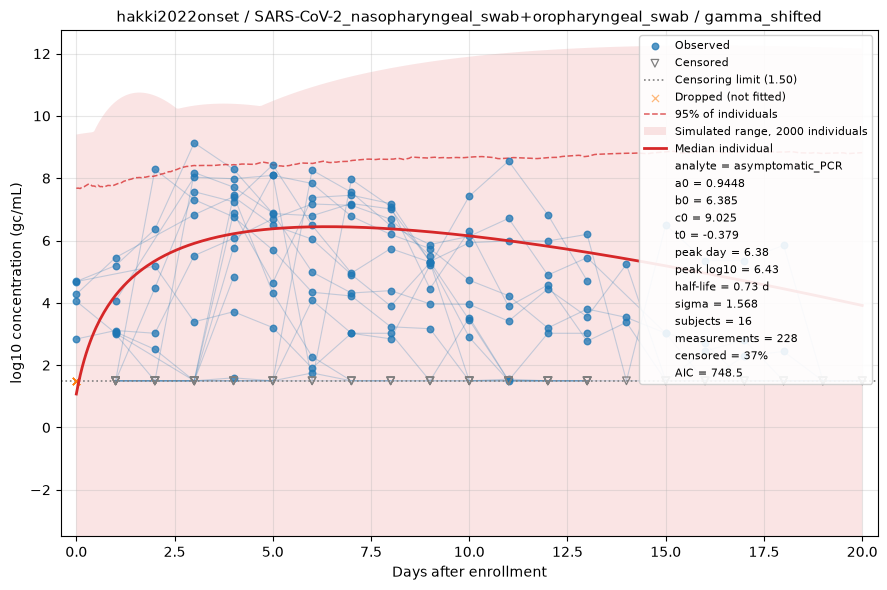
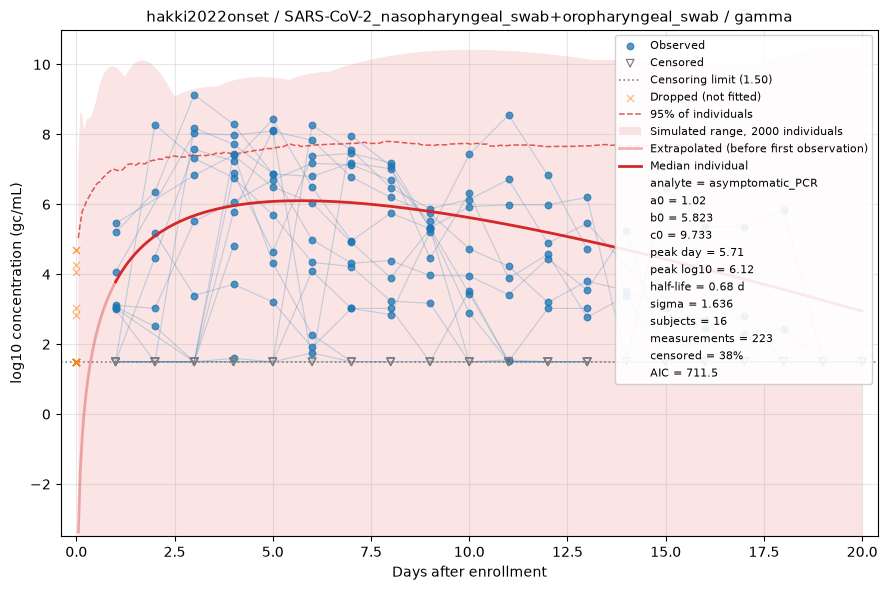
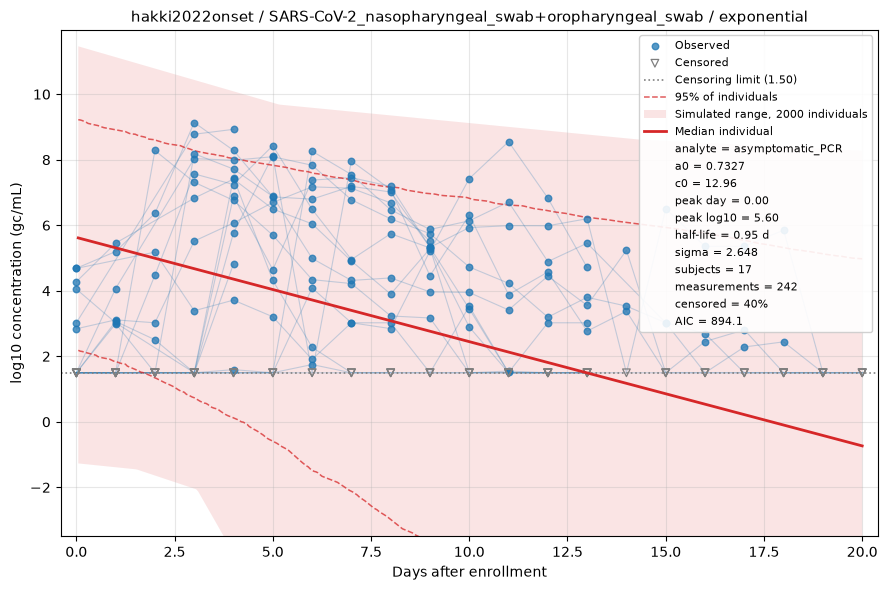
Fitted by censored maximum likelihood. The red line is the median individual; the shaded region is the full range of a simulated cohort drawn from the fitted population, so it shows what simulating from this dataset would produce rather than a confidence interval, with dashed lines at the central 95%. Open triangles are non-detects, drawn at the censoring limit and entering the fit as "below this value" rather than being dropped. See the modelling methods for what these estimates do and do not support.
asymptomatic_cultivable
The infectious virus analyte consisted of culturable SARS-CoV-2 derived from throat and nasal swabs of asymptomatic participants, measured using a plaque assay in vitro. The unit of measurement was PFU/mL, with enrollment as the primary reference event.
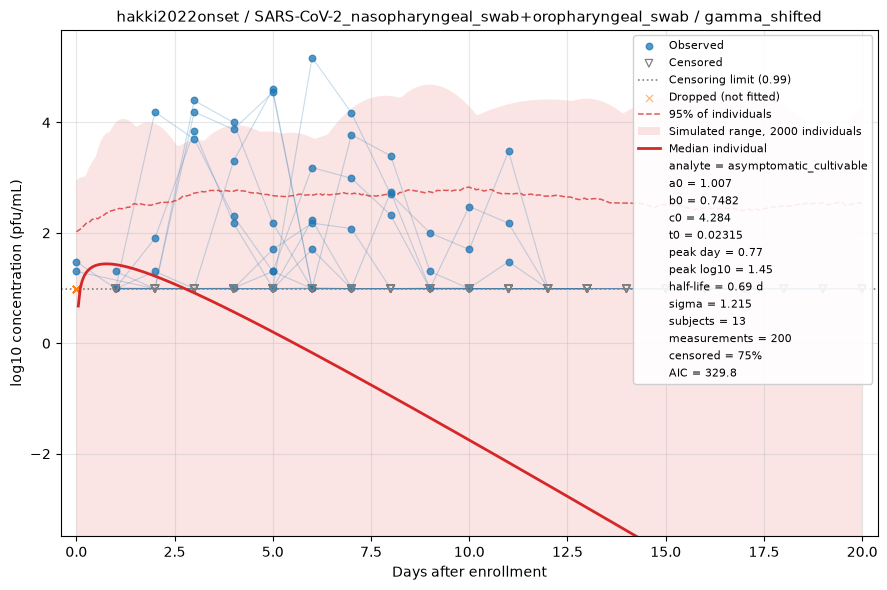
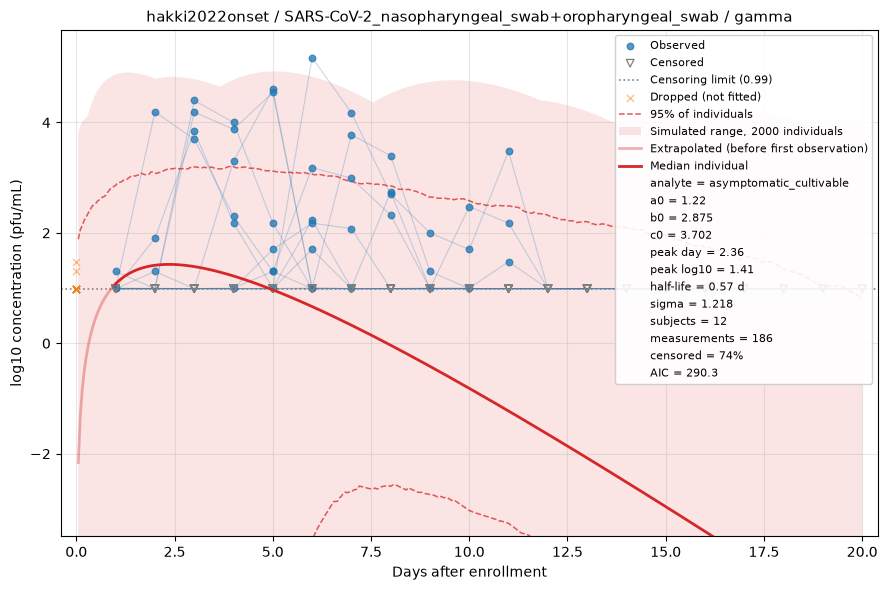
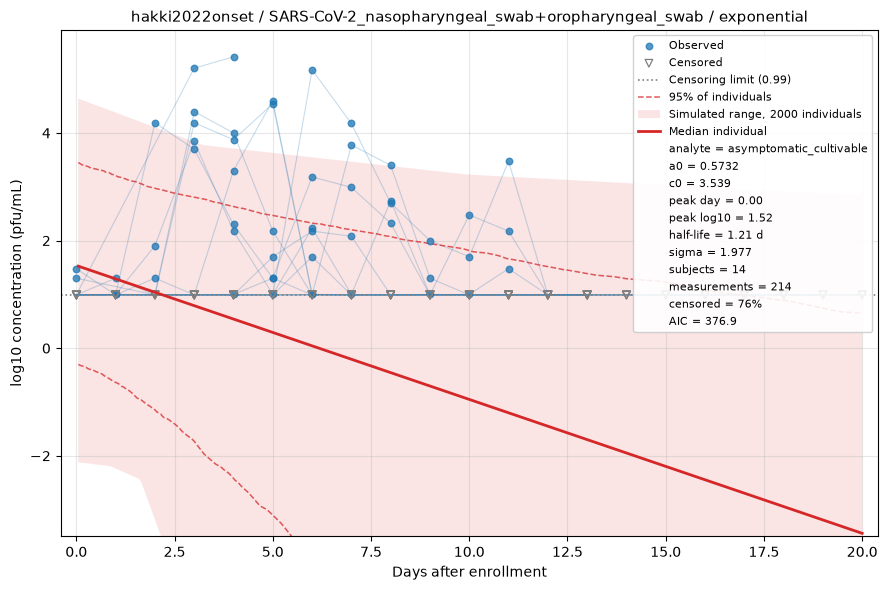
Fitted by censored maximum likelihood. The red line is the median individual; the shaded region is the full range of a simulated cohort drawn from the fitted population, so it shows what simulating from this dataset would produce rather than a confidence interval, with dashed lines at the central 95%. Open triangles are non-detects, drawn at the censoring limit and entering the fit as "below this value" rather than being dropped. See the modelling methods for what these estimates do and do not support.
symptomatic_PCR
This analyte represents the detection and quantification of SARS-CoV-2 viral RNA from throat and nose swabs specimens collected from symptomatic participants. The analysis focuses on measuring the viral load expressed in log10 copies/mL, with the primary reference event being the symptom onset.
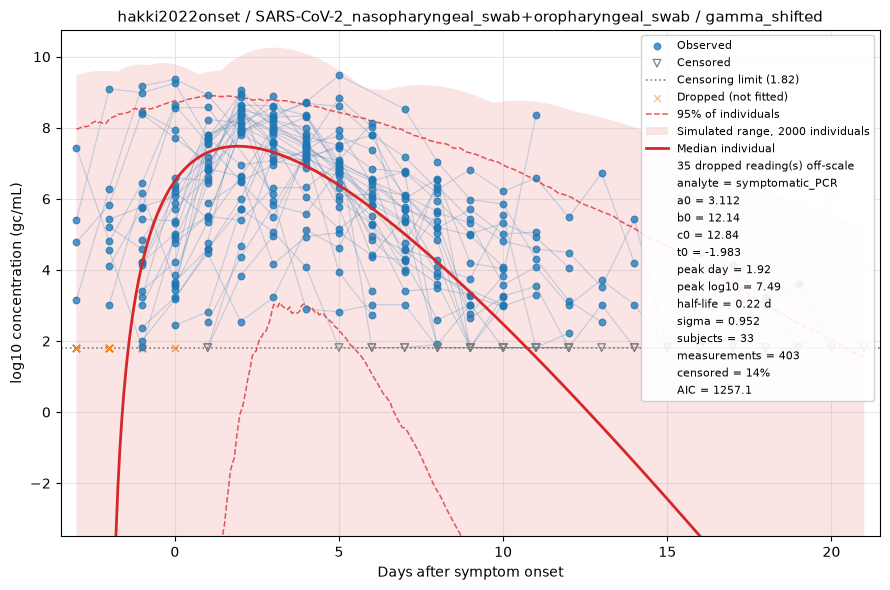
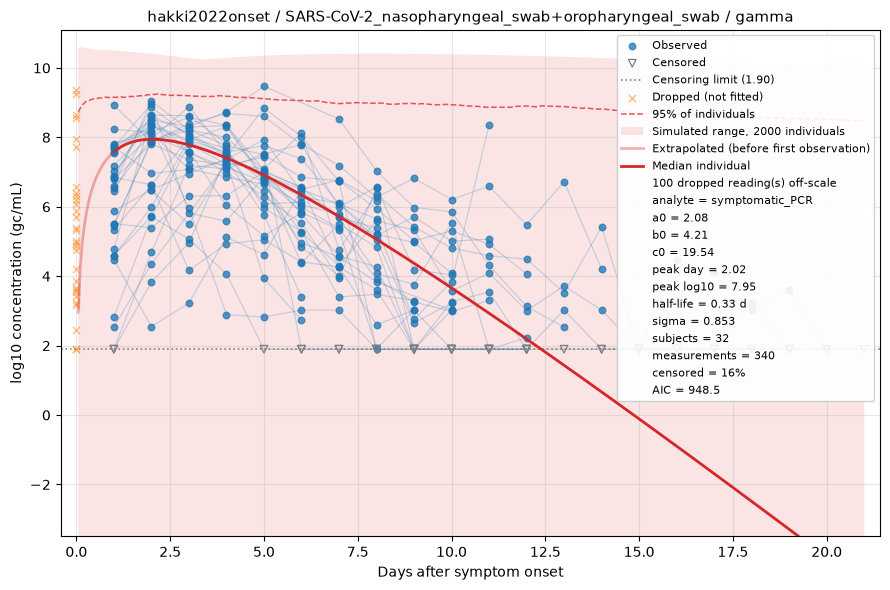
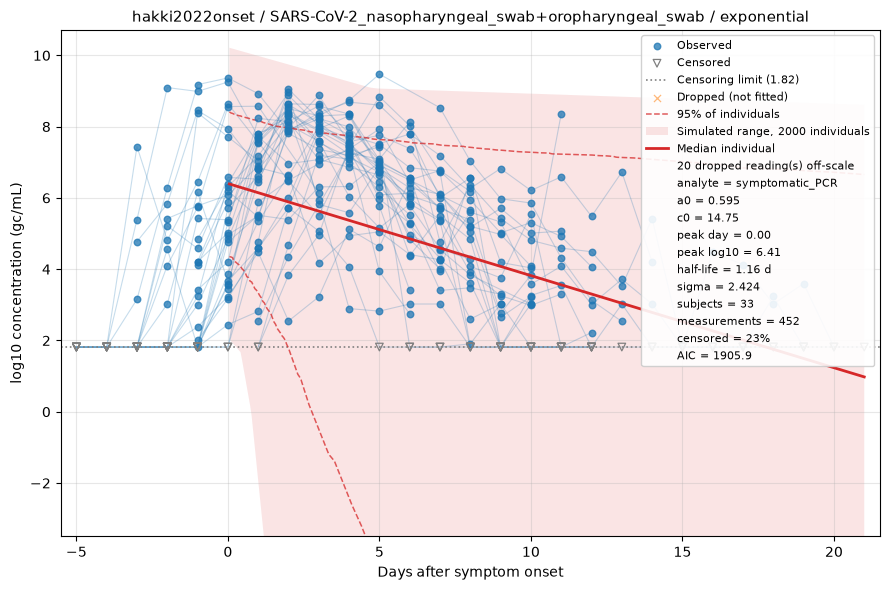
Fitted by censored maximum likelihood. The red line is the median individual; the shaded region is the full range of a simulated cohort drawn from the fitted population, so it shows what simulating from this dataset would produce rather than a confidence interval, with dashed lines at the central 95%. Open triangles are non-detects, drawn at the censoring limit and entering the fit as "below this value" rather than being dropped. See the modelling methods for what these estimates do and do not support.
symptomatic_cultivable
The infectious virus analyte consisted of culturable SARS-CoV-2 derived from throat and nasal swabs of symptomatic participants, measured using a plaque assay in vitro. The unit of measurement was PFU/mL, with symptom onset as the primary reference event.
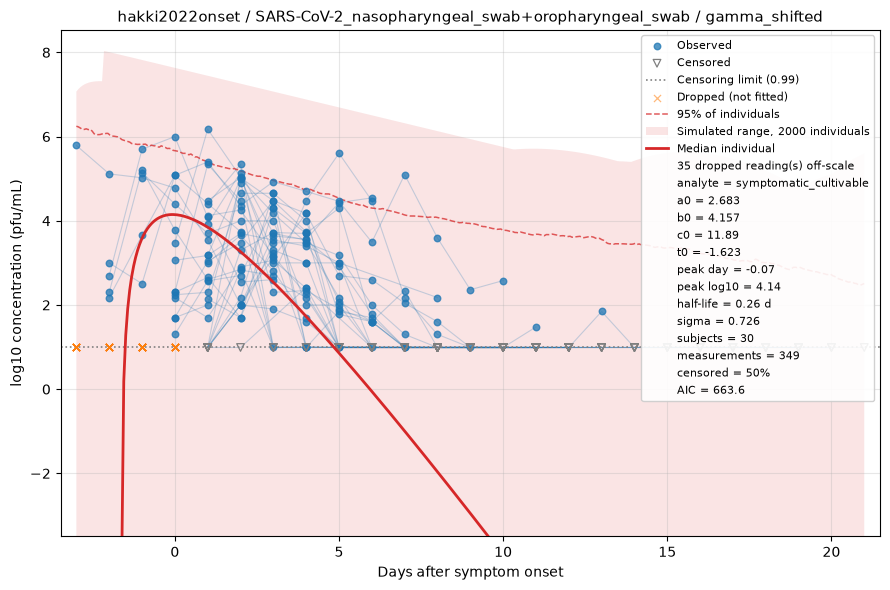
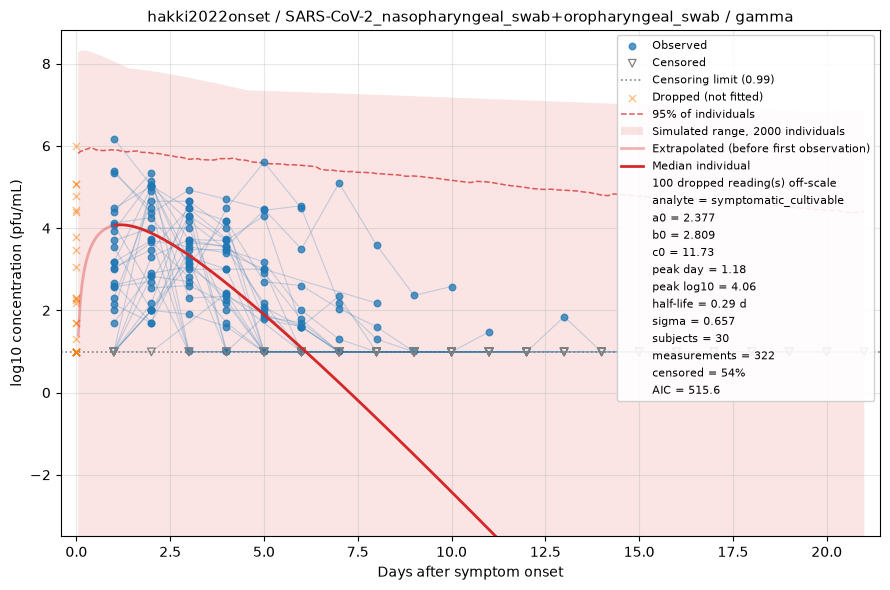
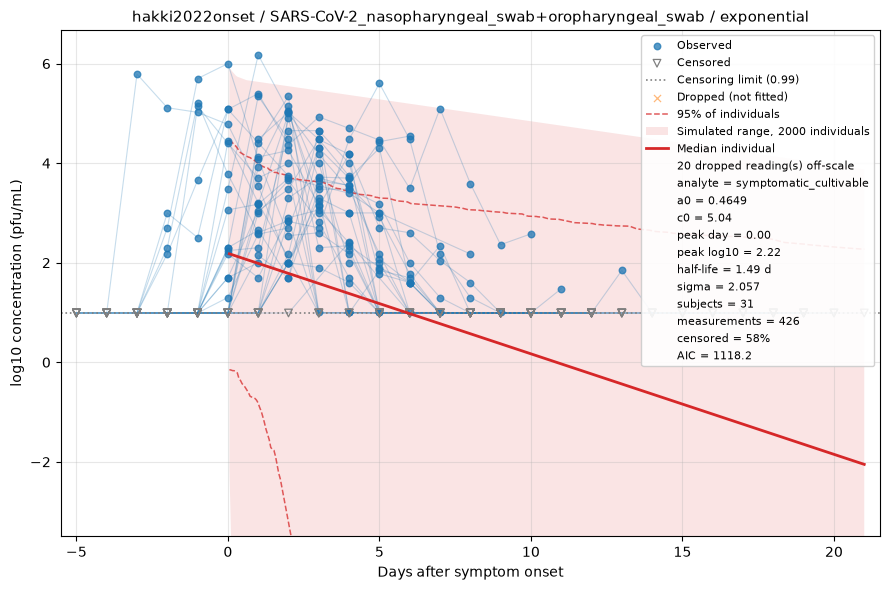
Fitted by censored maximum likelihood. The red line is the median individual; the shaded region is the full range of a simulated cohort drawn from the fitted population, so it shows what simulating from this dataset would produce rather than a confidence interval, with dashed lines at the central 95%. Open triangles are non-detects, drawn at the censoring limit and entering the fit as "below this value" rather than being dropped. See the modelling methods for what these estimates do and do not support.