Viral load in hospitalized infants with respiratory syncytial virus bronchiolitis: a three-way comparative analysis golantripto2024viral
Prospective cohort study of hospitalized infants (<12 months) with acute bronchiolitis at Soroka Medical Center. For each infant, paired respiratory specimens were collected at hospital admission (day 0) and ~48 hours later (day 2): nasopharyngeal swabs and nasal lavage (nasal wash) fluid, each placed in two different transport media (UTM and VCM). Quantitative RT-PCR viral load results (reported as virus particles per mL, vp/mL) are provided here from figure-derived CSV data, stratified by specimen type and transport medium; RSV subtype (A or B) is available per patient in the CSV.
Analytes
utm_vp_ml_nasopharyngeal_swab
Quantitative RT-PCR viral load reported as virus particles per mL (vp/mL) from nasopharyngeal (nasal) swab specimens collected at hospital admission (day 0) and 48 hours later (day 2), stored and tested as described in the paper; specimen placed into UTM transport medium.
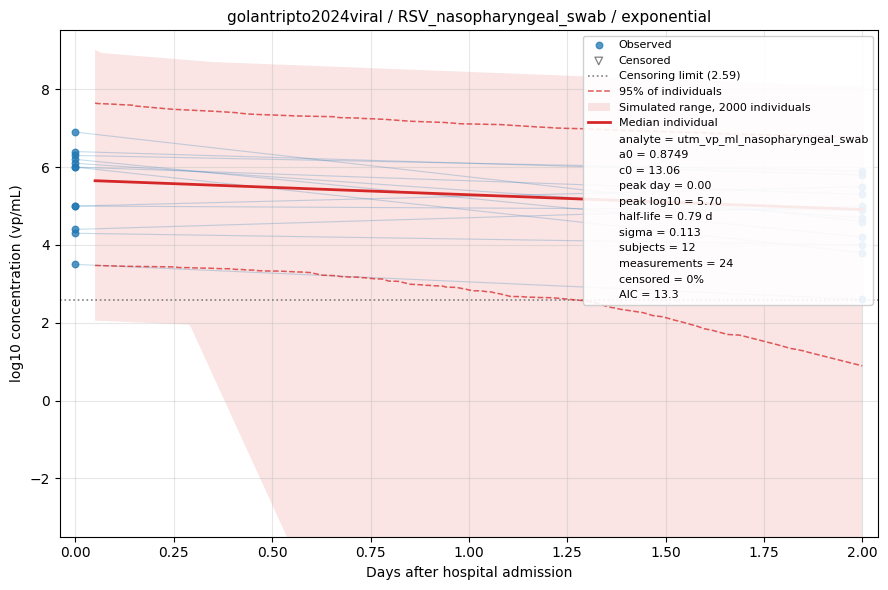
Fitted by censored maximum likelihood. The red line is the median individual; the shaded region is the full range of a simulated cohort drawn from the fitted population, so it shows what simulating from this dataset would produce rather than a confidence interval, with dashed lines at the central 95%. Open triangles are non-detects, drawn at the censoring limit and entering the fit as "below this value" rather than being dropped. See the modelling methods for what these estimates do and do not support.
vcm_vp_ml_nasopharyngeal_swab
Quantitative RT-PCR viral load reported as virus particles per mL (vp/mL) from nasopharyngeal (nasal) swab specimens collected at hospital admission (day 0) and 48 hours later (day 2), stored and tested as described in the paper; specimen placed into VCM transport medium.
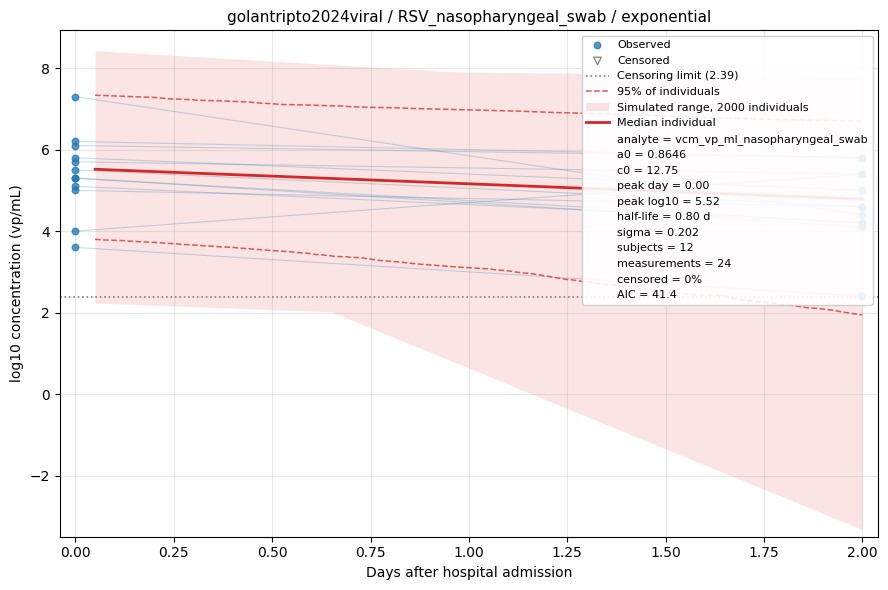
Fitted by censored maximum likelihood. The red line is the median individual; the shaded region is the full range of a simulated cohort drawn from the fitted population, so it shows what simulating from this dataset would produce rather than a confidence interval, with dashed lines at the central 95%. Open triangles are non-detects, drawn at the censoring limit and entering the fit as "below this value" rather than being dropped. See the modelling methods for what these estimates do and do not support.
utm_vp_ml_nasal_lavage_fluid
Quantitative RT-PCR viral load reported as virus particles per mL (vp/mL) from nasal lavage (nasal wash) fluid specimens collected at hospital admission (day 0) and 48 hours later (day 2), stored and tested as described in the paper; specimen placed into UTM transport medium.
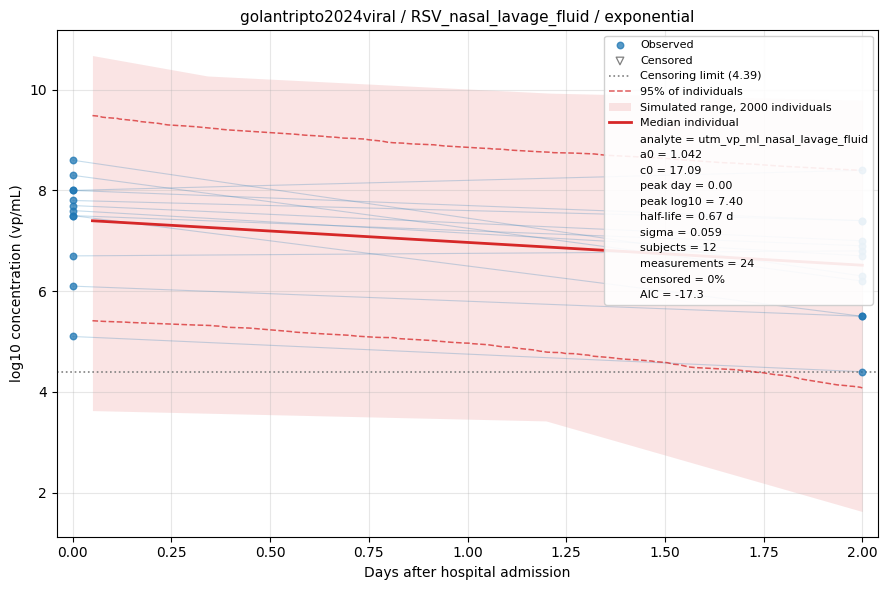
Fitted by censored maximum likelihood. The red line is the median individual; the shaded region is the full range of a simulated cohort drawn from the fitted population, so it shows what simulating from this dataset would produce rather than a confidence interval, with dashed lines at the central 95%. Open triangles are non-detects, drawn at the censoring limit and entering the fit as "below this value" rather than being dropped. See the modelling methods for what these estimates do and do not support.
vcm_vp_ml_nasal_lavage_fluid
Quantitative RT-PCR viral load reported as virus particles per mL (vp/mL) from nasal lavage (nasal wash) fluid specimens collected at hospital admission (day 0) and 48 hours later (day 2), stored and tested as described in the paper; specimen placed into VCM transport medium.
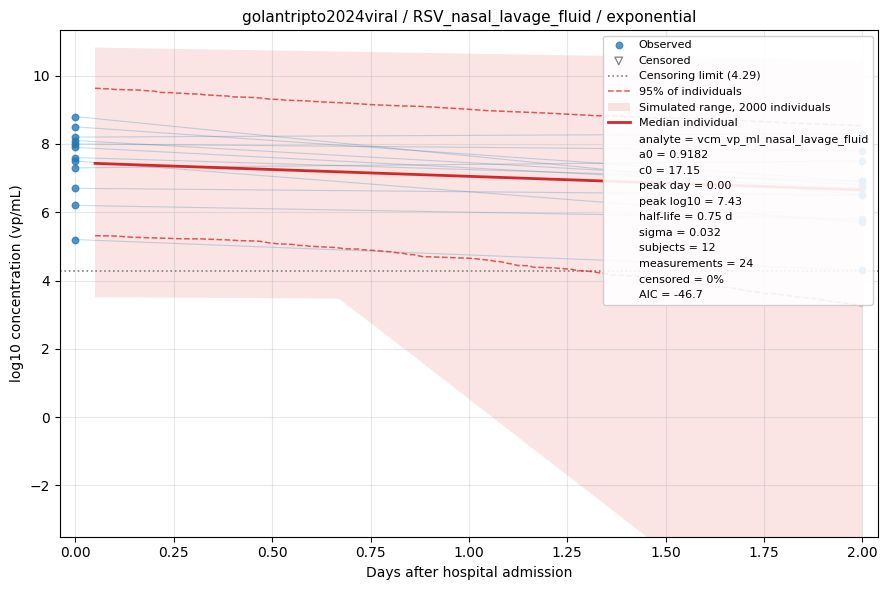
Fitted by censored maximum likelihood. The red line is the median individual; the shaded region is the full range of a simulated cohort drawn from the fitted population, so it shows what simulating from this dataset would produce rather than a confidence interval, with dashed lines at the central 95%. Open triangles are non-detects, drawn at the censoring limit and entering the fit as "below this value" rather than being dropped. See the modelling methods for what these estimates do and do not support.