Effect of Norovirus Inoculum Dose on Virus Kinetics, Shedding, and Symptoms ge2023effect
Secondary analysis of a human norovirus GI.1 challenge study (ClinicalTrials.gov NCT00138476) examining how inoculum dose (0.48, 4.8, 48, 4,800 RT-PCR units) affects shedding kinetics and symptoms. Feces and vomit samples were collected frequently during the first 96 hours after inoculation and then for 4–8 weeks postinoculation. Virus shedding was measured by IMC RT-PCR (qualitative) and qRT-PCR (quantitative genomic equivalent copies). This extraction contains digitized fecal shedding measurements for dose 4,800 RT-PCR units from the provided figure-data CSV (Batch 1/8).
Analytes
4800_stool
Norovirus GI.1 challenge study fecal shedding measurement for participants inoculated with 4,800 RT-PCR units. Virus shedding concentration measured by IMC RT-PCR (qualitative positive/negative) and/or real-time quantitative RT-PCR (qRT-PCR) reported as genomic equivalent copies per gram of stool; values below assay limits may appear as qualitative results in the digitized dataset.
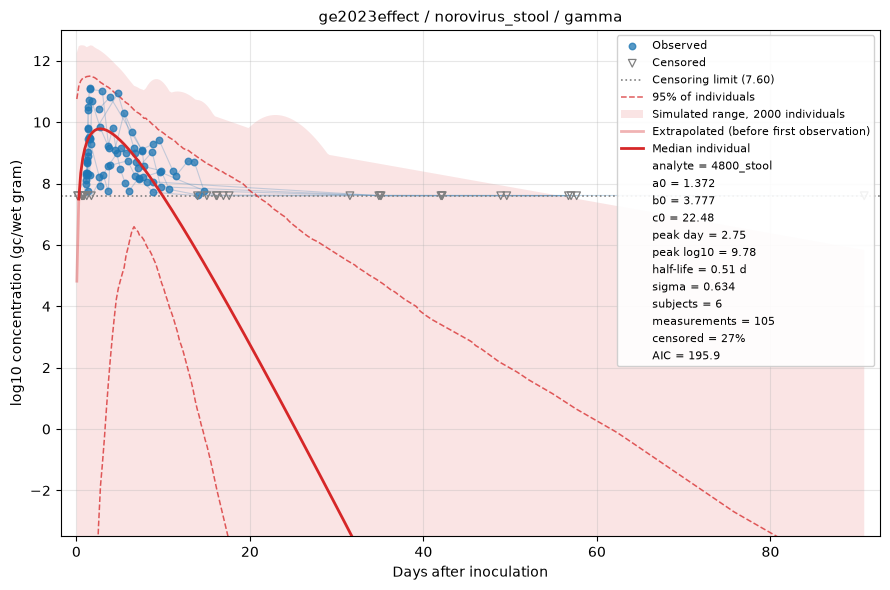
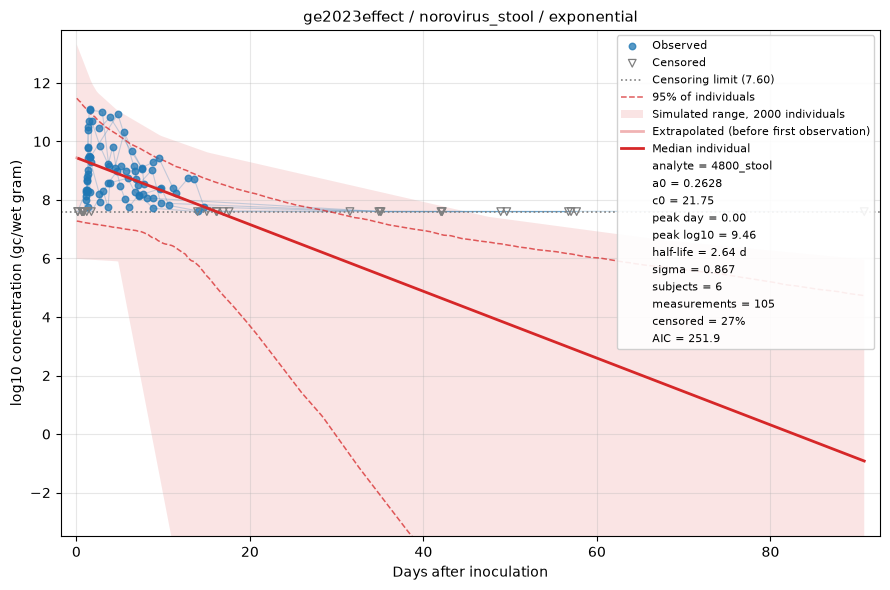
Fitted by censored maximum likelihood. The red line is the median individual; the shaded region is the full range of a simulated cohort drawn from the fitted population, so it shows what simulating from this dataset would produce rather than a confidence interval, with dashed lines at the central 95%. Open triangles are non-detects, drawn at the censoring limit and entering the fit as "below this value" rather than being dropped. See the modelling methods for what these estimates do and do not support.
48_stool
Required CSV analyte key present in study instructions (not populated in this CSV batch).
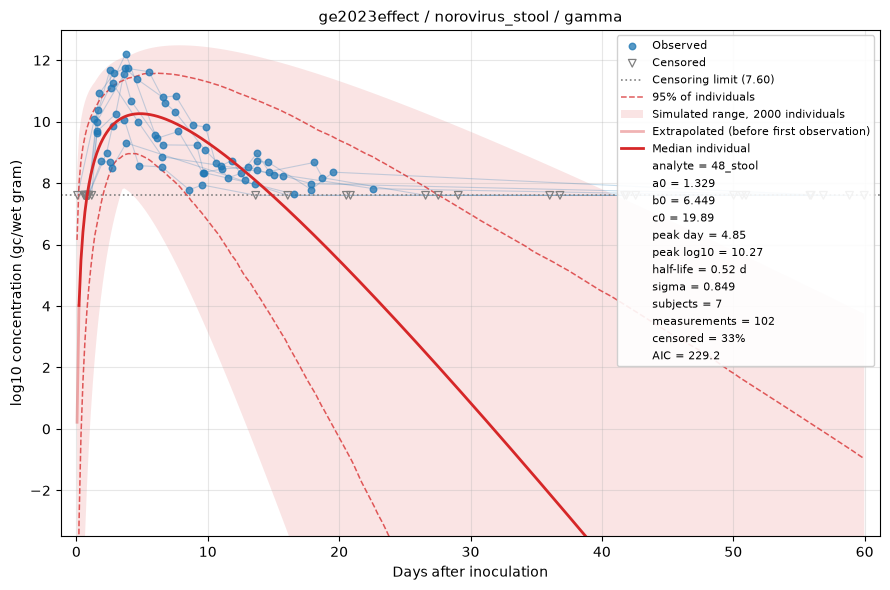
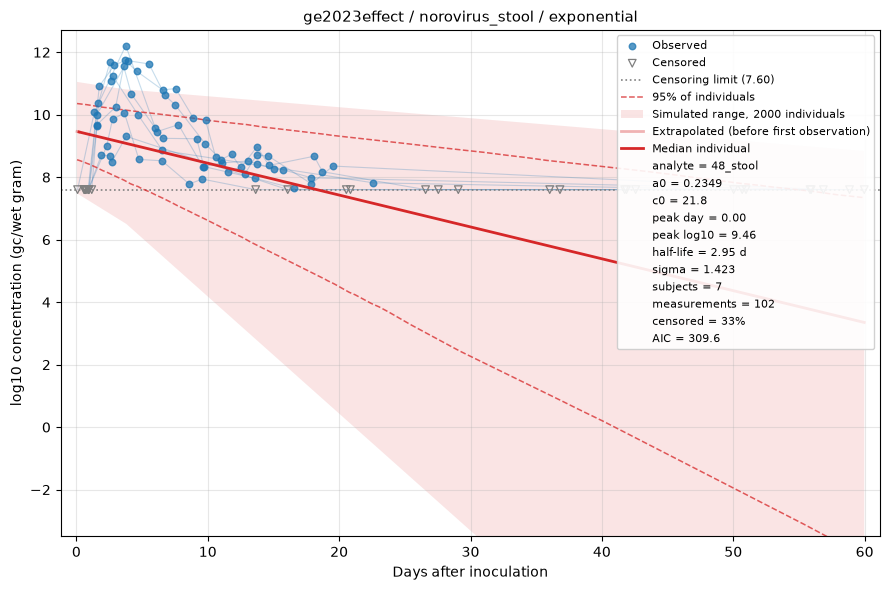
Fitted by censored maximum likelihood. The red line is the median individual; the shaded region is the full range of a simulated cohort drawn from the fitted population, so it shows what simulating from this dataset would produce rather than a confidence interval, with dashed lines at the central 95%. Open triangles are non-detects, drawn at the censoring limit and entering the fit as "below this value" rather than being dropped. See the modelling methods for what these estimates do and do not support.
4_8_stool
Required CSV analyte key present in study instructions (not populated in this CSV batch).
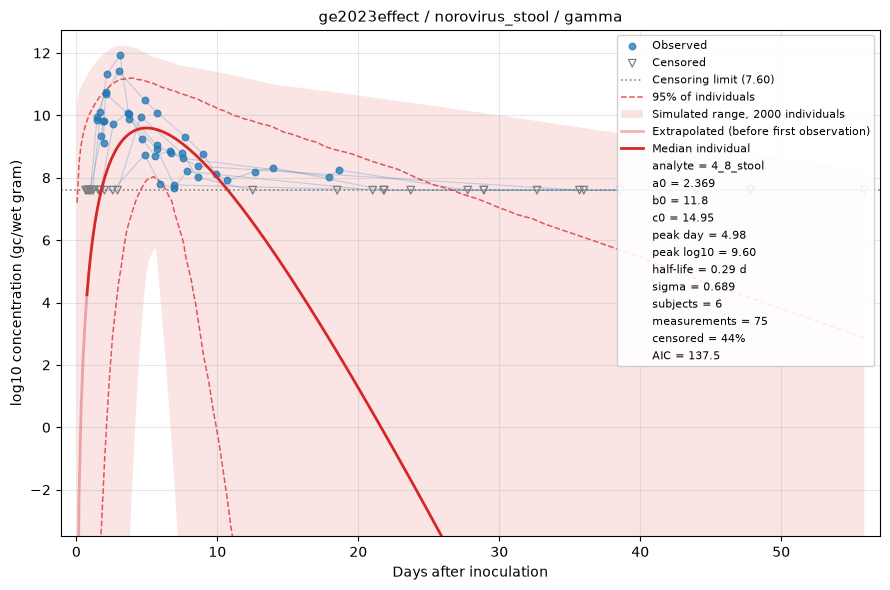
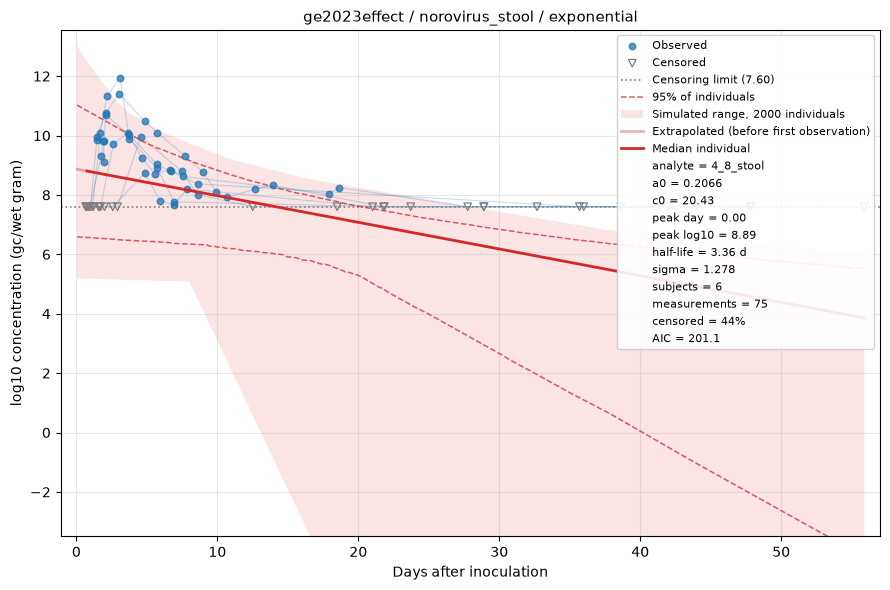
Fitted by censored maximum likelihood. The red line is the median individual; the shaded region is the full range of a simulated cohort drawn from the fitted population, so it shows what simulating from this dataset would produce rather than a confidence interval, with dashed lines at the central 95%. Open triangles are non-detects, drawn at the censoring limit and entering the fit as "below this value" rather than being dropped. See the modelling methods for what these estimates do and do not support.
0_48_stool
Required CSV analyte key present in study instructions (not populated in this CSV batch).
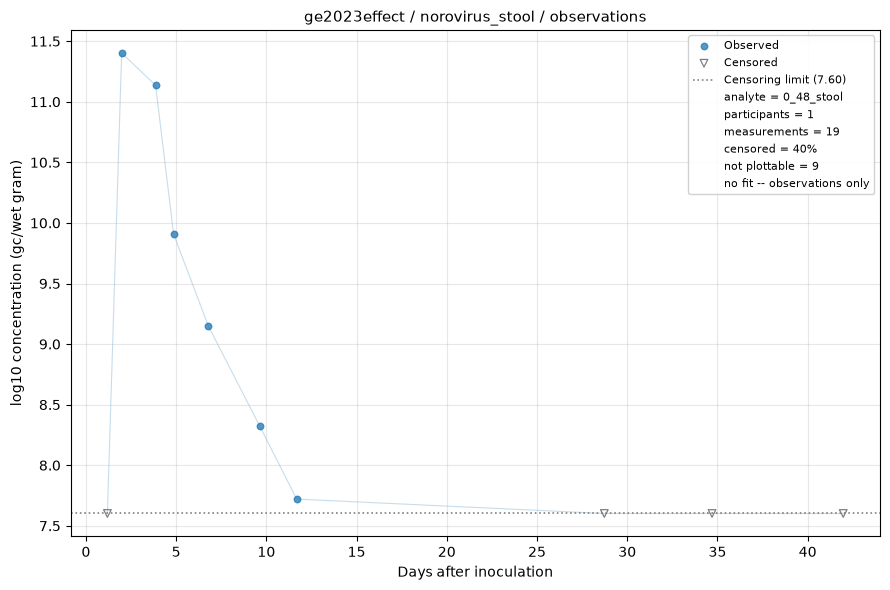
Measurements only — no shedding model is fitted to this analyte, usually because it is sampled once per participant, leaving no trajectory to fit, or because nothing was ever detected. Open triangles are non-detects, drawn at the assay's censoring limit. See the modelling methods for what these estimates do and do not support.
48_emesis
Required CSV analyte key present in study instructions (not populated in this CSV batch). The limit of detection (LOD) for emesis samples was set by the study authors at 220 (genomic equivalent copies).
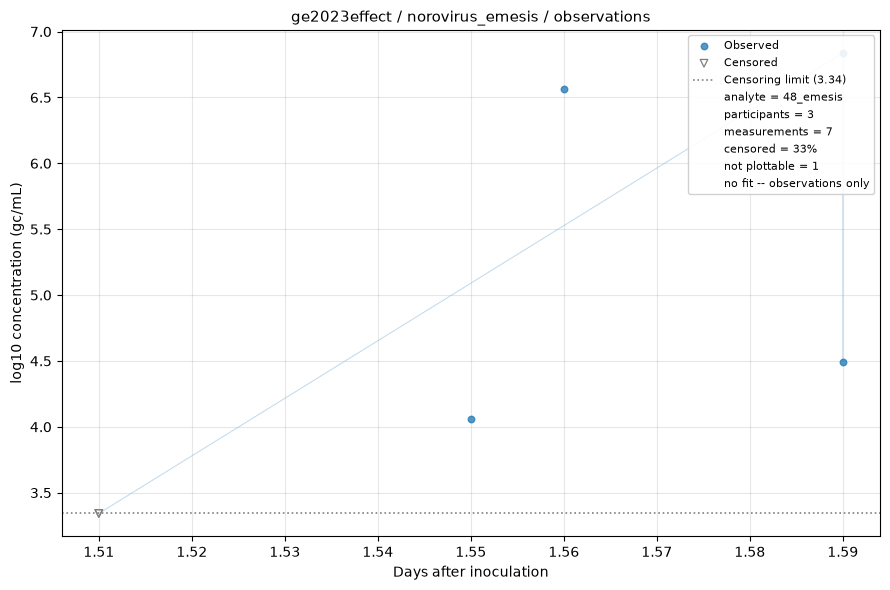
Measurements only — no shedding model is fitted to this analyte, usually because it is sampled once per participant, leaving no trajectory to fit, or because nothing was ever detected. Open triangles are non-detects, drawn at the assay's censoring limit. See the modelling methods for what these estimates do and do not support.
4_8_emesis
Required CSV analyte key present in study instructions (not populated in this CSV batch). The limit of detection (LOD) for emesis samples was set by the study authors at 220 (genomic equivalent copies).
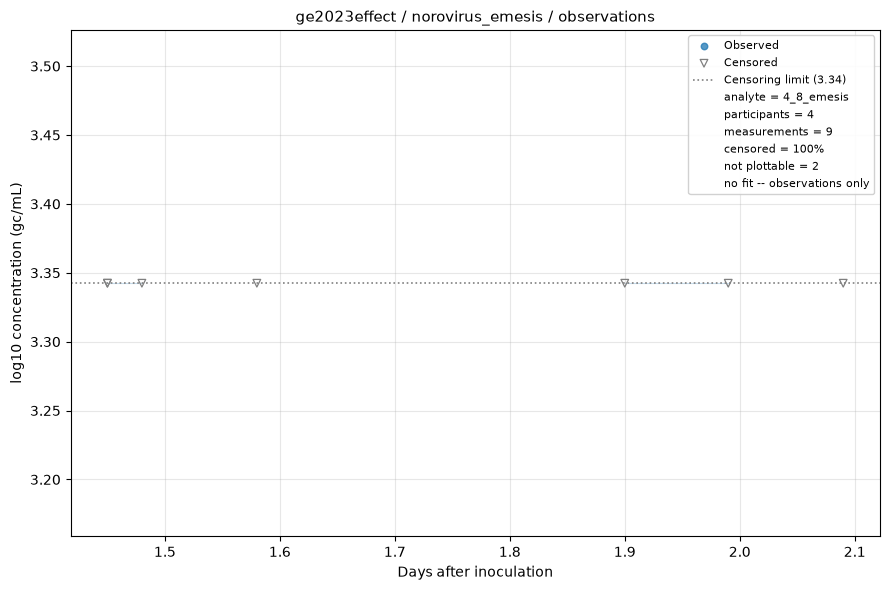
Measurements only — no shedding model is fitted to this analyte, usually because it is sampled once per participant, leaving no trajectory to fit, or because nothing was ever detected. Open triangles are non-detects, drawn at the assay's censoring limit. See the modelling methods for what these estimates do and do not support.
0_48_emesis
Required CSV analyte key present in study instructions (not populated in this CSV batch). The limit of detection (LOD) for emesis samples was set by the study authors at 220 (genomic equivalent copies).
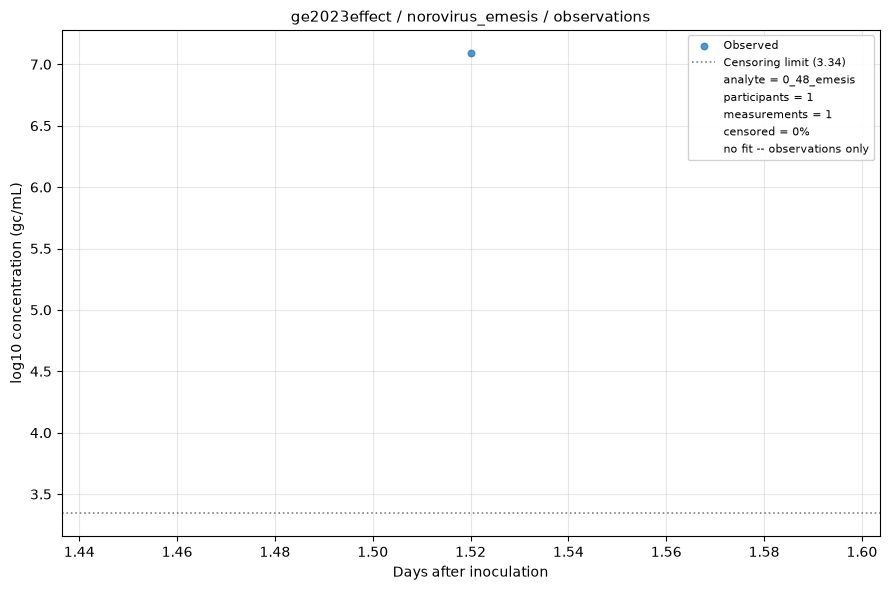
Measurements only — no shedding model is fitted to this analyte, usually because it is sampled once per participant, leaving no trajectory to fit, or because nothing was ever detected. Open triangles are non-detects, drawn at the assay's censoring limit. See the modelling methods for what these estimates do and do not support.
4800_emesis
Required CSV analyte key present in study instructions (not populated in this CSV batch). The limit of detection (LOD) for emesis samples was set by the study authors at 220 (genomic equivalent copies).
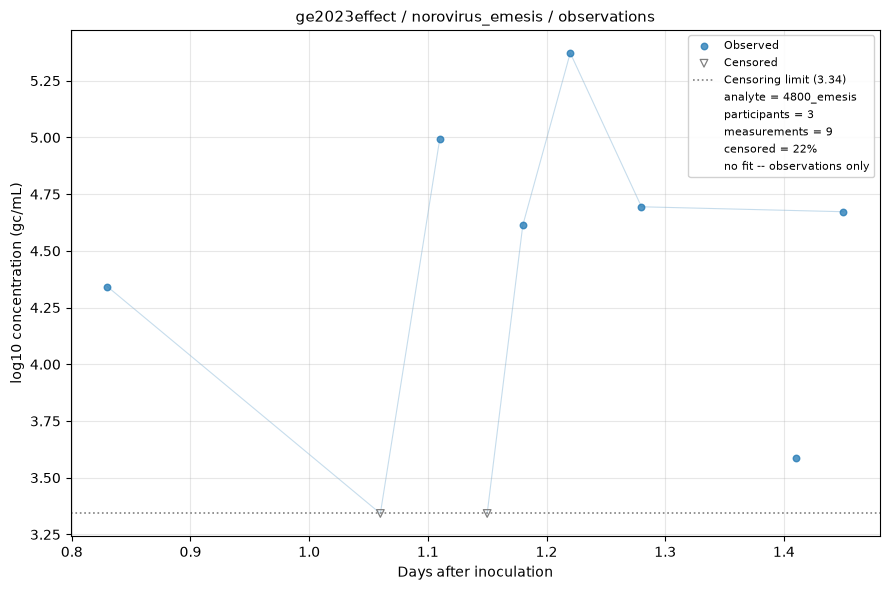
Measurements only — no shedding model is fitted to this analyte, usually because it is sampled once per participant, leaving no trajectory to fit, or because nothing was ever detected. Open triangles are non-detects, drawn at the assay's censoring limit. See the modelling methods for what these estimates do and do not support.