Rotavirus shedding following administration of RV3-BB human neonatal rotavirus vaccine cowley2017rotavirus
This study investigates the shedding and replication of the RV3-BB human neonatal rotavirus vaccine in a phase IIa trial conducted in Dunedin, New Zealand, from January 2012 to April 2014. The trial involved 96 healthy, full-term neonates who were randomly assigned to receive three doses of the RV3-BB vaccine or placebo. The study aimed to characterize rotavirus shedding in stool samples collected on days 3-7 post-vaccination using VP6 RT-PCR. The trial included neonatal and infant vaccination schedules, with the first dose administered at 0-5 days or 8 weeks after birth, respectively. The study found significant rotavirus shedding in both schedules, with >70% of participants shedding the vaccine virus. The study used quantitative qRT-PCR to measure stool viral load and assessed the relationship between viral load and serological response.
Analytes
stool_rotavirus_vaccine_dose1
Rotavirus vaccine shedding after dose 1
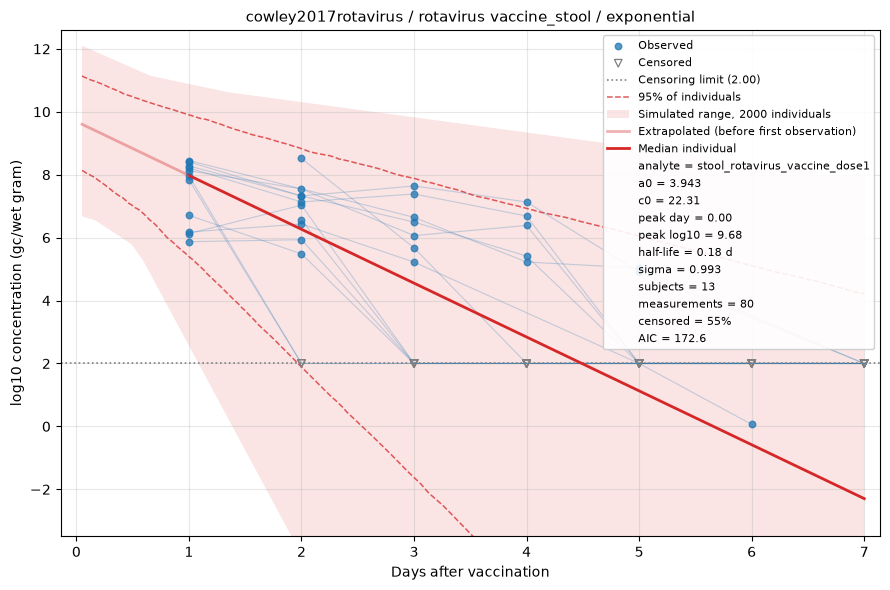
Fitted by censored maximum likelihood. The red line is the median individual; the shaded region is the full range of a simulated cohort drawn from the fitted population, so it shows what simulating from this dataset would produce rather than a confidence interval, with dashed lines at the central 95%. Open triangles are non-detects, drawn at the censoring limit and entering the fit as "below this value" rather than being dropped. See the modelling methods for what these estimates do and do not support.
stool_rotavirus_vaccine_dose2
Rotavirus vaccine shedding after dose 2
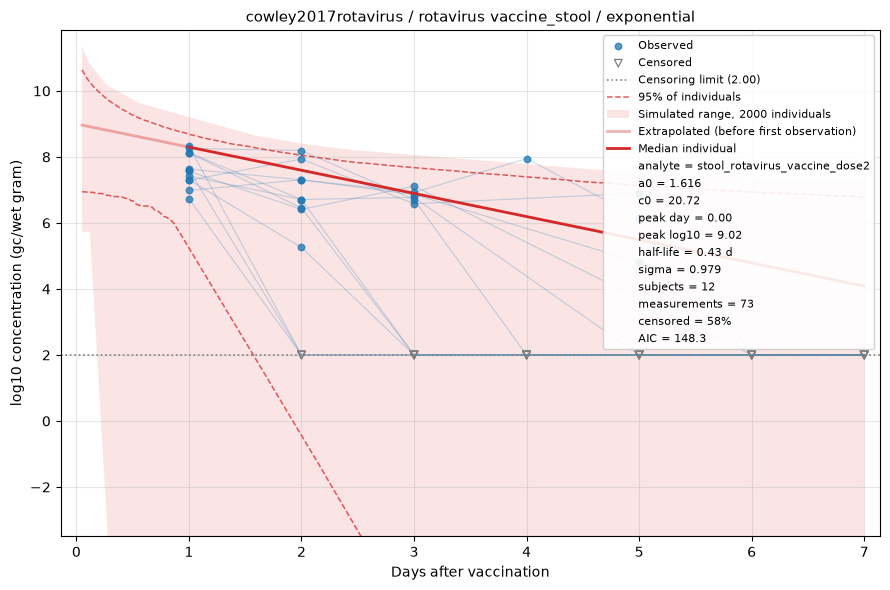
Fitted by censored maximum likelihood. The red line is the median individual; the shaded region is the full range of a simulated cohort drawn from the fitted population, so it shows what simulating from this dataset would produce rather than a confidence interval, with dashed lines at the central 95%. Open triangles are non-detects, drawn at the censoring limit and entering the fit as "below this value" rather than being dropped. See the modelling methods for what these estimates do and do not support.
stool_rotavirus_vaccine_dose3
Rotavirus vaccine shedding after dose 3
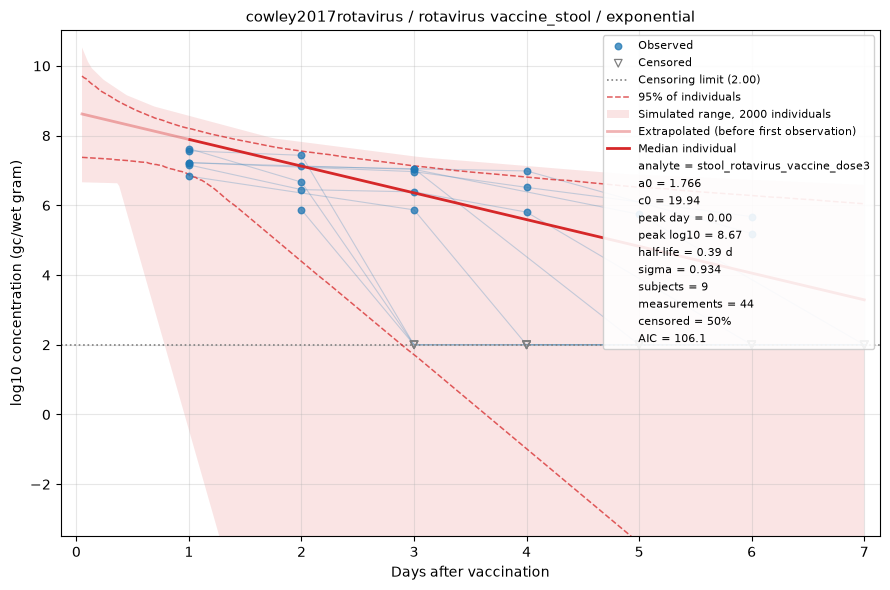
Fitted by censored maximum likelihood. The red line is the median individual; the shaded region is the full range of a simulated cohort drawn from the fitted population, so it shows what simulating from this dataset would produce rather than a confidence interval, with dashed lines at the central 95%. Open triangles are non-detects, drawn at the censoring limit and entering the fit as "below this value" rather than being dropped. See the modelling methods for what these estimates do and do not support.