Clinical and virologic characteristics of the first 12 patients with coronavirus disease 2019 (COVID-19) in the United States covid2020clinical
This study describes the first 12 COVID-19 patients identified in the United States, tracking their clinical progression and virological characteristics. SARS-CoV-2 was detected by real-time reverse transcriptase PCR in stool, urine, serum, sputum, oropharyngeal and nasopharyngeal swabs for 2 to 3 weeks after symptom onset. Results were reported in cycle threshold (Ct) values.
Analytes
Stool_SARSCoV2
SARS-CoV-2 RNA gene copy concentration in stool samples. The results were reported in cycle threshold numbers.
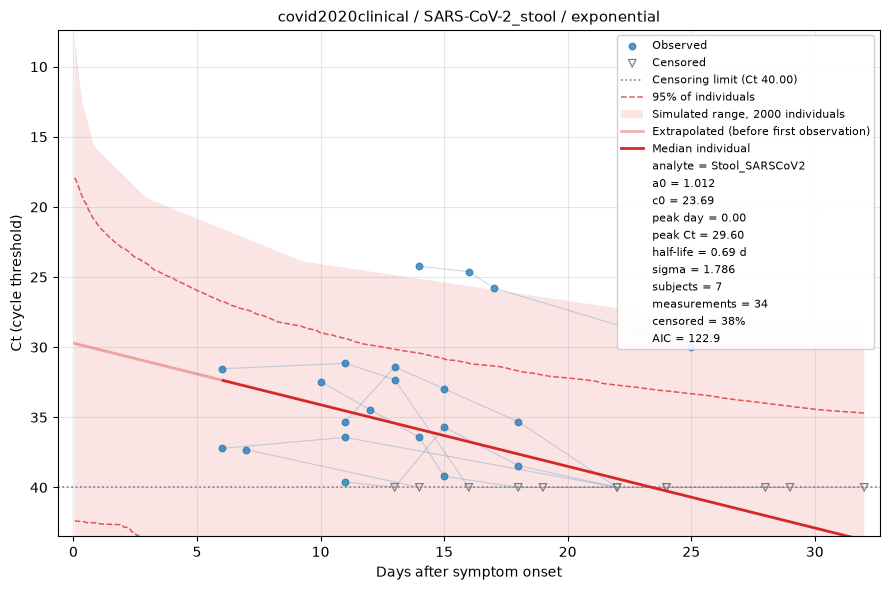
Fitted by censored maximum likelihood. The red line is the median individual; the shaded region is the full range of a simulated cohort drawn from the fitted population, so it shows what simulating from this dataset would produce rather than a confidence interval, with dashed lines at the central 95%. Open triangles are non-detects, drawn at the censoring limit and entering the fit as "below this value" rather than being dropped. See the modelling methods for what these estimates do and do not support.
Serum_SARSCoV2
SARS-CoV-2 RNA gene copy concentration in serum samples. The results were reported in cycle threshold numbers.
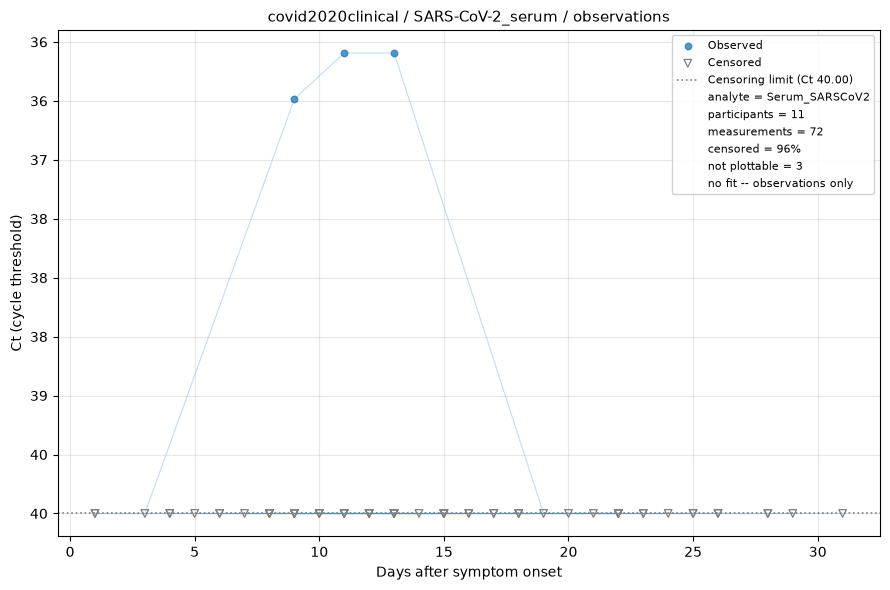
Measurements only — no shedding model is fitted to this analyte, usually because it is sampled once per participant, leaving no trajectory to fit, or because nothing was ever detected. Open triangles are non-detects, drawn at the assay's censoring limit. See the modelling methods for what these estimates do and do not support.
Sputum_SARSCoV2
SARS-CoV-2 RNA gene copy concentration in sputum samples. The results were reported in cycle threshold numbers.
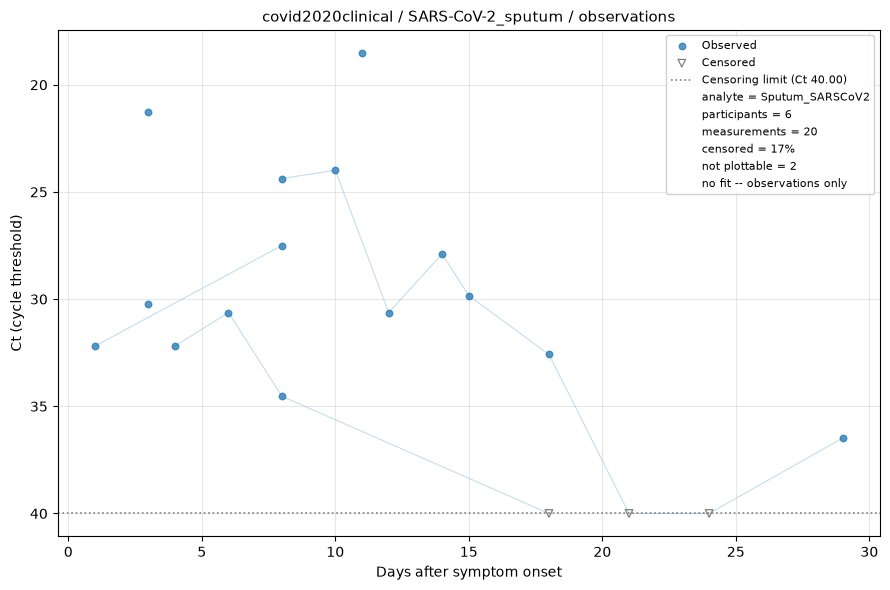
Measurements only — no shedding model is fitted to this analyte, usually because it is sampled once per participant, leaving no trajectory to fit, or because nothing was ever detected. Open triangles are non-detects, drawn at the assay's censoring limit. See the modelling methods for what these estimates do and do not support.
OPS_SARSCoV2
SARS-CoV-2 RNA gene copy concentration in oropharyngeal samples. The results were reported in cycle threshold numbers.
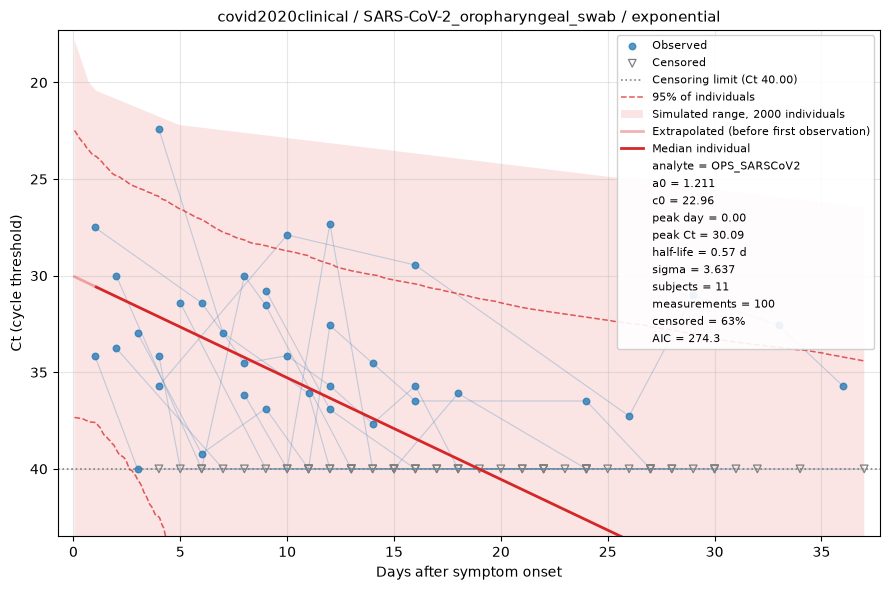
Fitted by censored maximum likelihood. The red line is the median individual; the shaded region is the full range of a simulated cohort drawn from the fitted population, so it shows what simulating from this dataset would produce rather than a confidence interval, with dashed lines at the central 95%. Open triangles are non-detects, drawn at the censoring limit and entering the fit as "below this value" rather than being dropped. See the modelling methods for what these estimates do and do not support.
NPS_SARSCoV2
SARS-CoV-2 RNA gene copy concentration in nasopharyngeal samples. The results were reported in cycle threshold numbers.
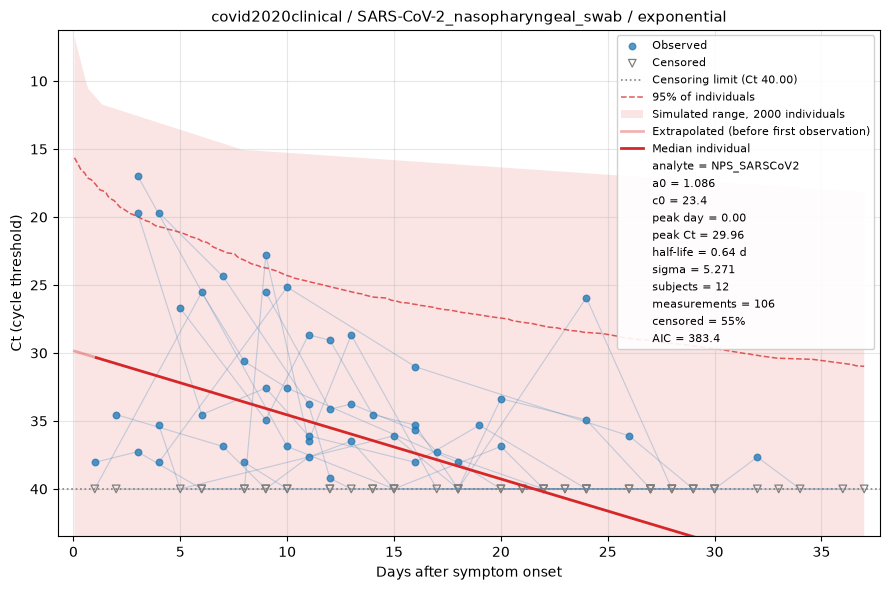
Fitted by censored maximum likelihood. The red line is the median individual; the shaded region is the full range of a simulated cohort drawn from the fitted population, so it shows what simulating from this dataset would produce rather than a confidence interval, with dashed lines at the central 95%. Open triangles are non-detects, drawn at the censoring limit and entering the fit as "below this value" rather than being dropped. See the modelling methods for what these estimates do and do not support.
Urine_SARSCoV2
SARS-CoV-2 RNA gene copy concentration in urine samples. The results were reported in cycle threshold numbers.
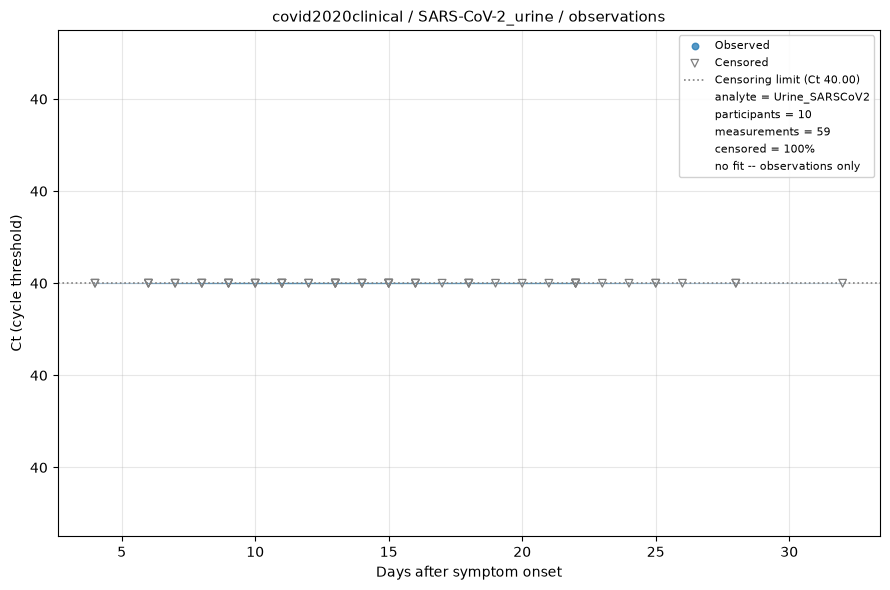
Measurements only — no shedding model is fitted to this analyte, usually because it is sampled once per participant, leaving no trajectory to fit, or because nothing was ever detected. Open triangles are non-detects, drawn at the assay's censoring limit. See the modelling methods for what these estimates do and do not support.