Centers for Disease Control and Prevention (CDC) Nursing Home Public Health Response Network (NHPHRN) cdc2024nhphrn
The INHERENT study, part of the CDC funded Nursing Home Public Health Response Network (NHPHRN), examined SARSCoV2 shedding in nursing home residents and staff. It characterized the viral shedding kinetics including proliferation, peak, and clearance using qRTPCR, antigen testing, genetic sequencing, and culture. The original dataset is published and updated on their GitHub repository (https://github.com/YWAN446/cdc2024nhphrn/tree/main/).
Analytes
NP_SARSCoV2_VL
Viral concentrations were quantified using RTqPCR targeting the N and S genes in nasopharyngeal swab samples with the TaqPath COVID19, Flu A, Flu B Combo Kit. One nasal swab was processed using the TaqPath Combo Kit on the QuantStudio 7 Pro, which provided results for all three analytes. For specimens with a SARSCoV2 cycle threshold (Ct) value below 30, a second analysis was performed using the CDC Influenza SARSCoV2 (Flu SC2) Multiplex Assay on the ABT 7500 Fast Dx. The reference event, “confirmation date”, is defined as the date of the initial positive test.
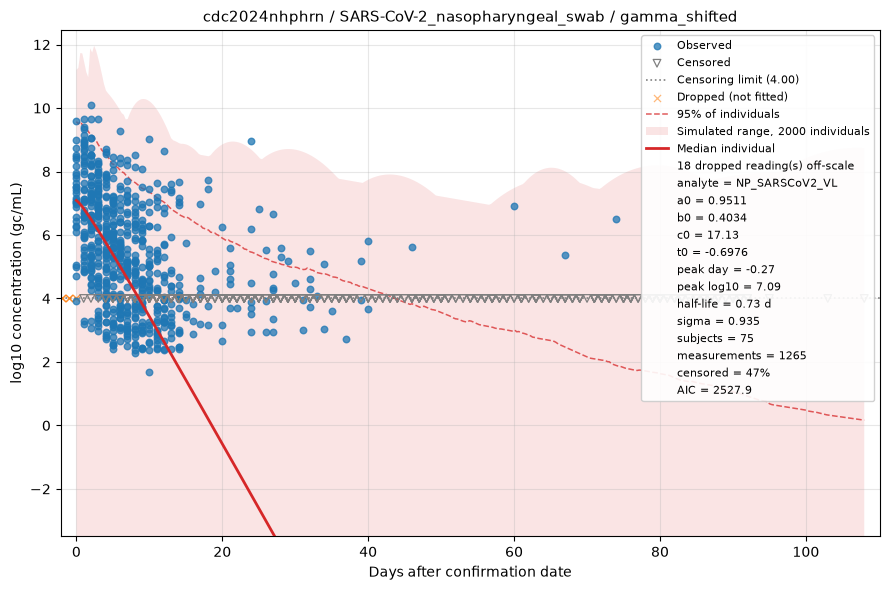
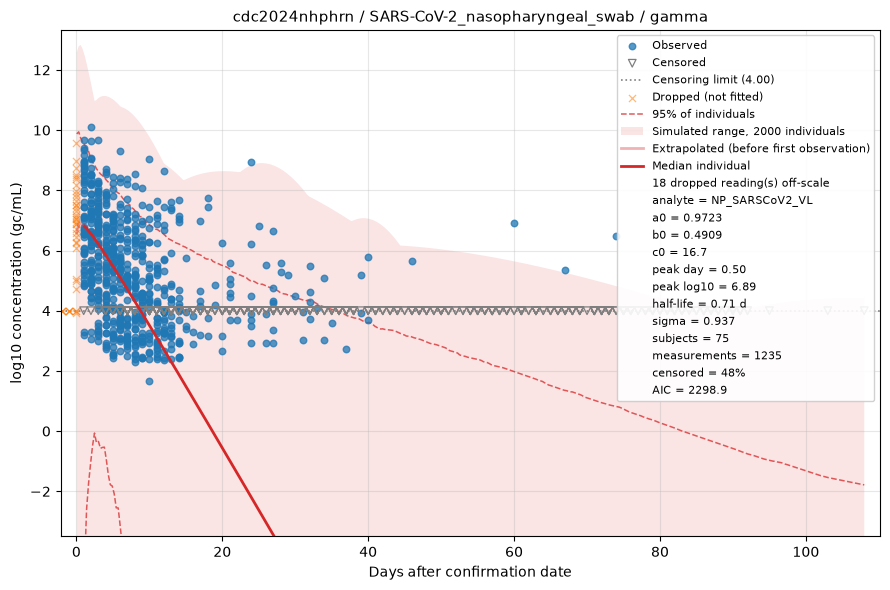
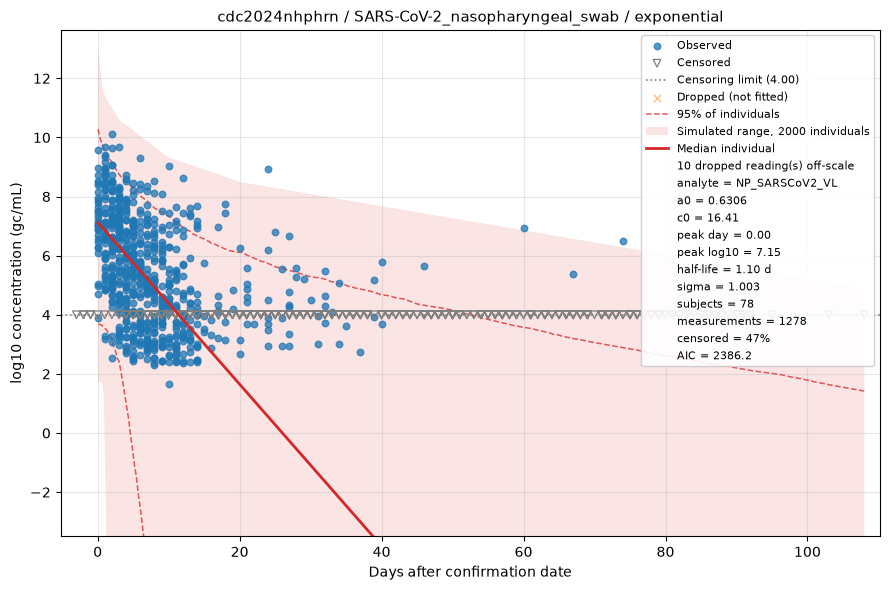
Fitted by censored maximum likelihood. The red line is the median individual; the shaded region is the full range of a simulated cohort drawn from the fitted population, so it shows what simulating from this dataset would produce rather than a confidence interval, with dashed lines at the central 95%. Open triangles are non-detects, drawn at the censoring limit and entering the fit as "below this value" rather than being dropped. See the modelling methods for what these estimates do and do not support.
NP_SARSCoV2_CT
Cycle threshold (Ct) values were measured using RTqPCR targeting the N and S genes in nasopharyngeal swab samples with the TaqPath COVID19, Flu A, Flu B Combo Kit. One nasal swab was processed using the TaqPath Combo Kit on the QuantStudio 7 Pro, which provided results for all three analytes. For specimens with a SARSCoV2 cycle threshold value below 30, a second analysis was performed using the CDC Influenza SARSCoV2 (Flu SC2) Multiplex Assay on the ABT 7500 Fast Dx. The reference event, “confirmation date”, is defined as the date of the initial positive test.
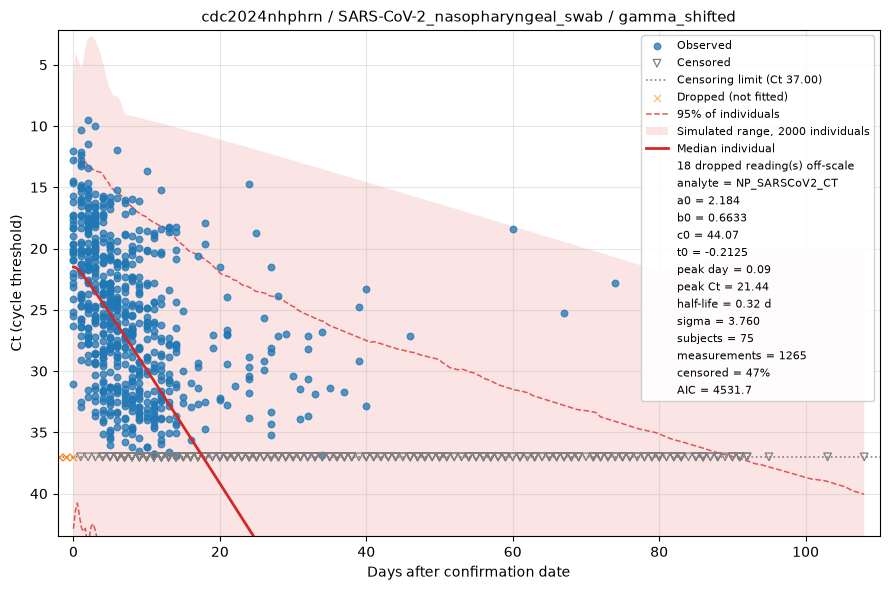
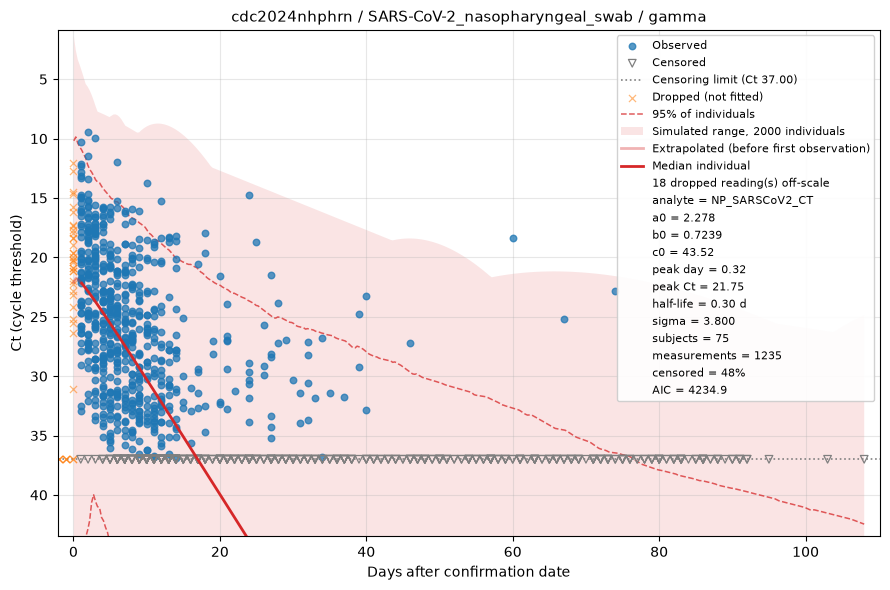
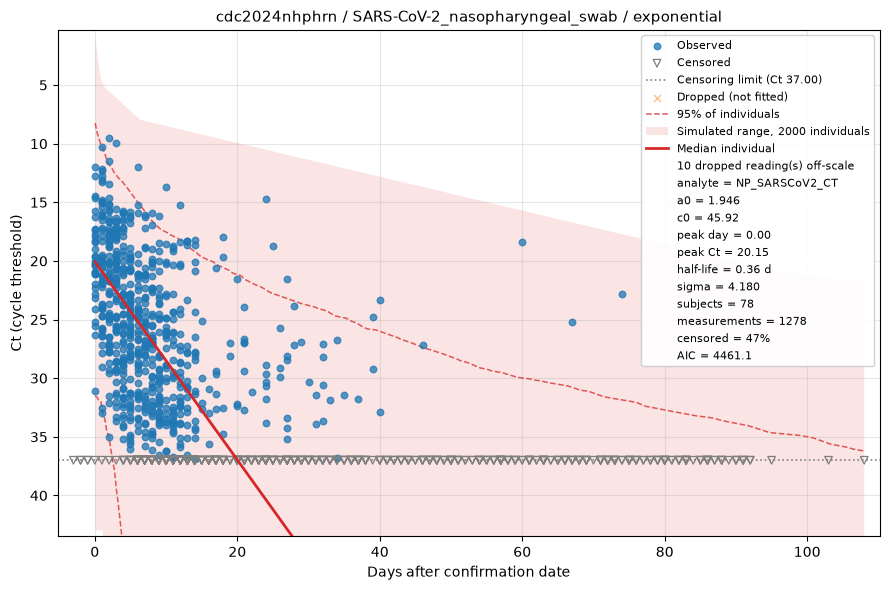
Fitted by censored maximum likelihood. The red line is the median individual; the shaded region is the full range of a simulated cohort drawn from the fitted population, so it shows what simulating from this dataset would produce rather than a confidence interval, with dashed lines at the central 95%. Open triangles are non-detects, drawn at the censoring limit and entering the fit as "below this value" rather than being dropped. See the modelling methods for what these estimates do and do not support.