Longitudinal and quantitative fecal shedding dynamics of SARS-CoV-2, pepper mild mottle virus, and crAssphage arts2023longitudinal
The authors present longitudinal, quantitative fecal shedding data for SARS-CoV-2 RNA, pepper mild mottle virus (PMMoV) RNA, and crAss-like phage (crAssphage) DNA from 48 COVID-19 patients. Abundances were quantified using (RT)-ddPCR assays targeting the N and ORF1a genes. The data were obtained from supplementary material.
Analytes
stool_SARSCoV2_N
Concentration of RNA of the N gene quantified using (RT)-ddPCR in stool samples. The concentration was quantified in gene copies per dry weight of stool. The limit of blank (LOB), determined as the upper 95% confidence limit of the negative extraction control, ranged from 11.2 to 1,550 gc/mg-dry weight. The reported number is either the measured concentration of SARS-CoV-2 N or the LOB if the concentration wasn’t detectable.
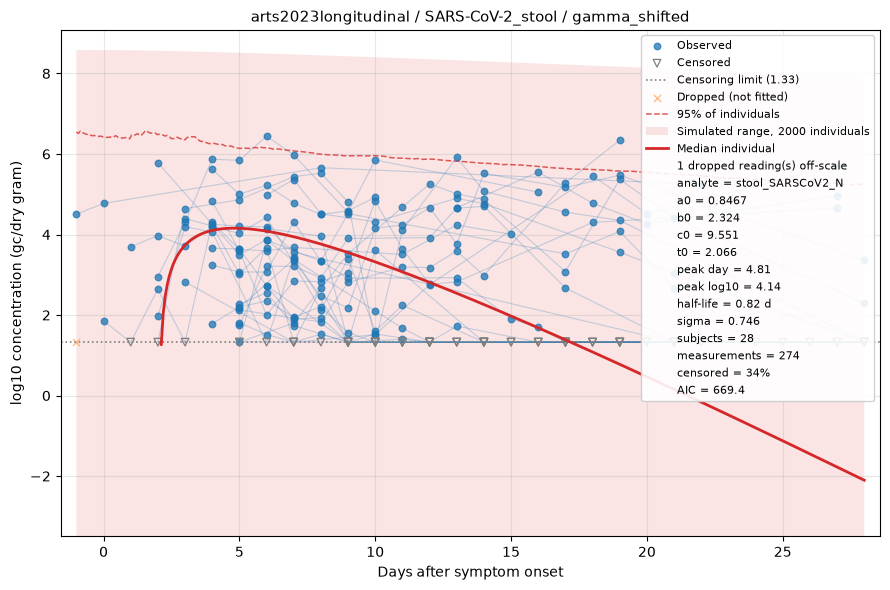
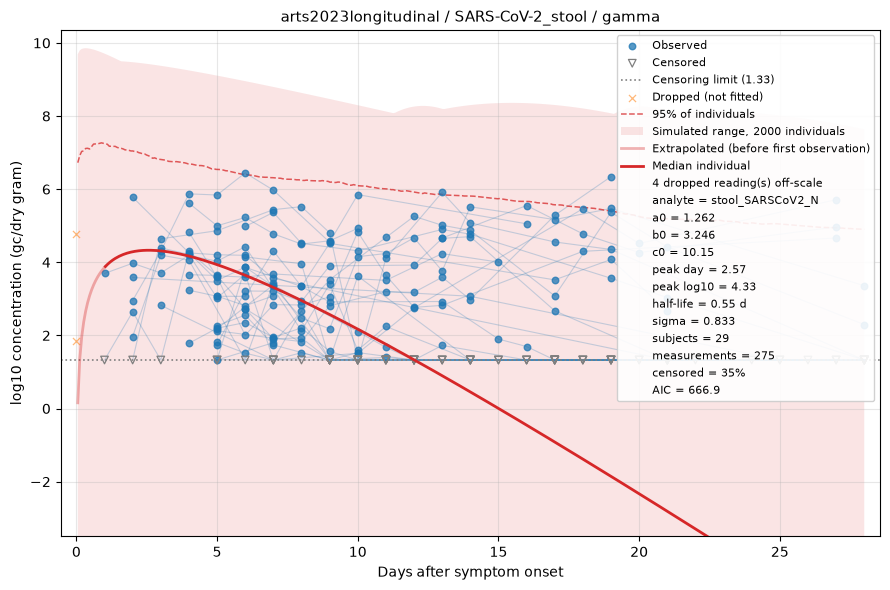
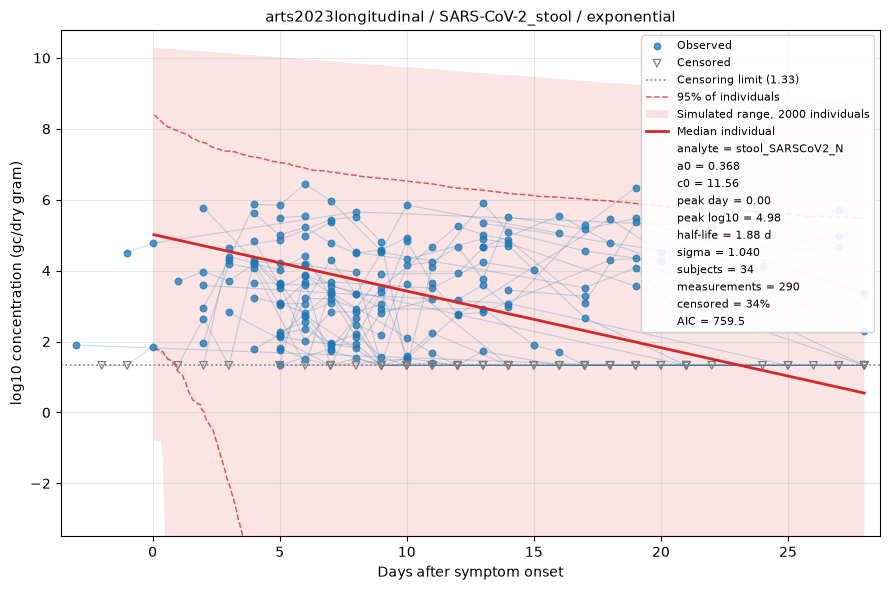
Fitted by censored maximum likelihood. The red line is the median individual; the shaded region is the full range of a simulated cohort drawn from the fitted population, so it shows what simulating from this dataset would produce rather than a confidence interval, with dashed lines at the central 95%. Open triangles are non-detects, drawn at the censoring limit and entering the fit as "below this value" rather than being dropped. See the modelling methods for what these estimates do and do not support.
stool_SARSCoV2_ORF1a
Concentration of RNA of the ORF1a gene quantified using (RT)-ddPCR in stool samples. The concentration was quantified in gene copies per dry weight of stool. The limit of blank (LOB), determined as the upper 95% confidence limit of the negative extraction control, ranged from 11.2 to 1,550 gc/mg-dry weight. The reported number is either the measured concentration of SARS-CoV-2 ORF1a or the LOB if the concentration wasn’t detectable.
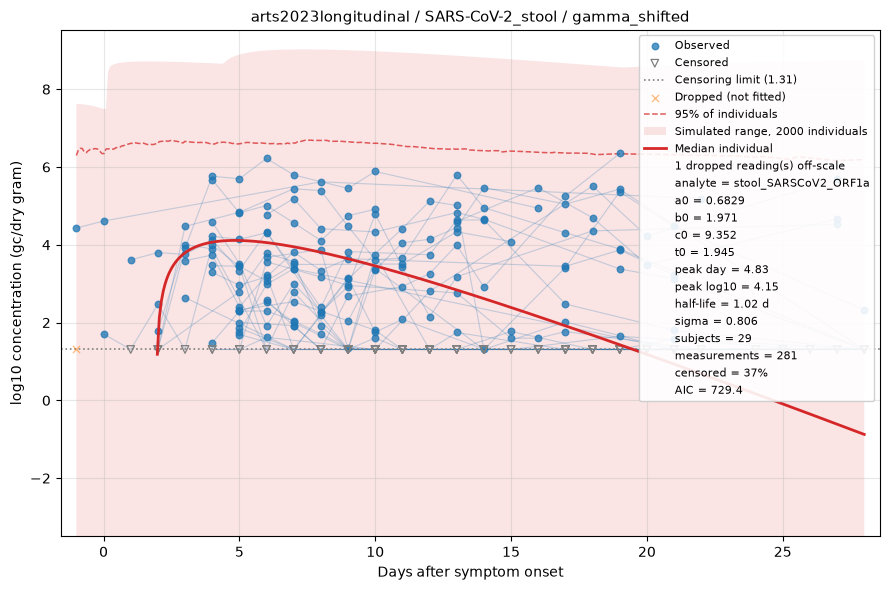
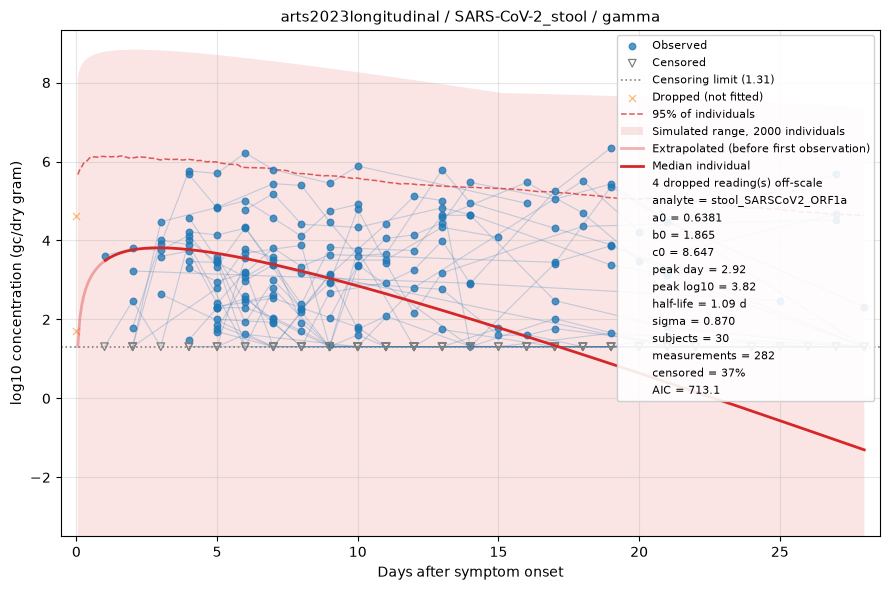
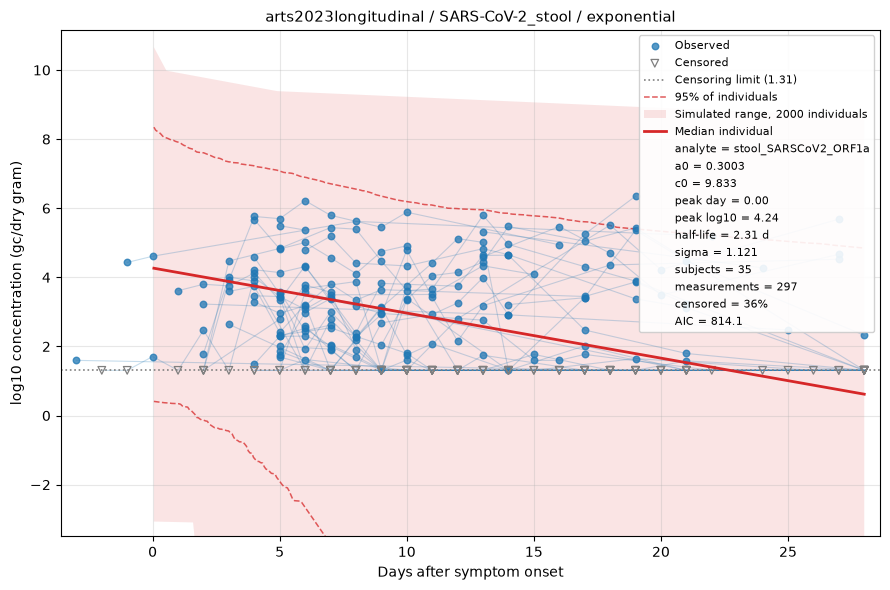
Fitted by censored maximum likelihood. The red line is the median individual; the shaded region is the full range of a simulated cohort drawn from the fitted population, so it shows what simulating from this dataset would produce rather than a confidence interval, with dashed lines at the central 95%. Open triangles are non-detects, drawn at the censoring limit and entering the fit as "below this value" rather than being dropped. See the modelling methods for what these estimates do and do not support.
stool_PMMoV
Concentration of PMMoV RNA was measured by ddPCR on the same day as the SARS-CoV-2. The concentration was quantified in gene copies per dry weight of stool. The reported number is either the measured concentration of PMMoV or the LOB if the concentration wasn’t detectable.
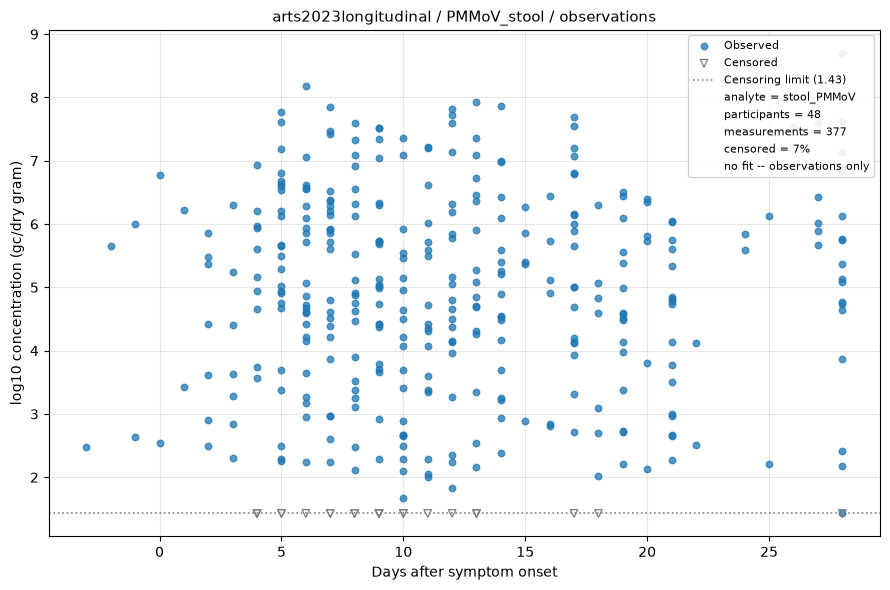
Measurements only — no shedding model is fitted to this analyte, usually because it is sampled once per participant, leaving no trajectory to fit, or because nothing was ever detected. Open triangles are non-detects, drawn at the assay's censoring limit. See the modelling methods for what these estimates do and do not support.
stool_crAssphage
Concentration of crAssphage DNA was measured using qPCR. The reported number is either the measured concentration of crAssphage or the Limit of Quantification (LOQ) if the concentration wasn’t quantifiable.
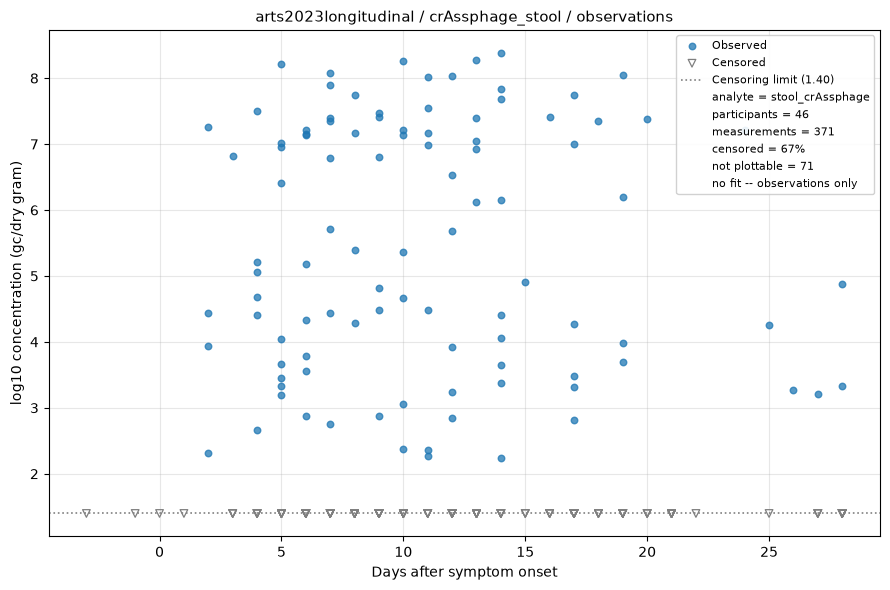
Measurements only — no shedding model is fitted to this analyte, usually because it is sampled once per participant, leaving no trajectory to fit, or because nothing was ever detected. Open triangles are non-detects, drawn at the assay's censoring limit. See the modelling methods for what these estimates do and do not support.