Efficacy and viral dynamics of tecovirimat in patients with MPOX: A multicenter open-label, double-arm trial in Japan akiyama2024efficacy
Multicenter open-label trial in Japan (Tecopox study) enrolling patients with mpox between June 28, 2022 and April 30, 2023. Nineteen patients were allocated to oral tecovirimat (no control arm enrolled). Serial PCR Ct values were measured from blood, urine, oropharyngeal (throat) swabs, skin lesion specimens, and semen to evaluate viral dynamics and duration of viral detection over time after study inclusion/tecovirimat treatment. The CSV provided contains individual-level Ct (cycle threshold) measurements by patient and day (time) for multiple specimen types; most results are negative at many timepoints.
Analytes
ct_blood
Mpox virus PCR cycle threshold (Ct) values from blood samples (CSV figure-derived data). Assay details and gene target not provided in the supplied text/CSV.
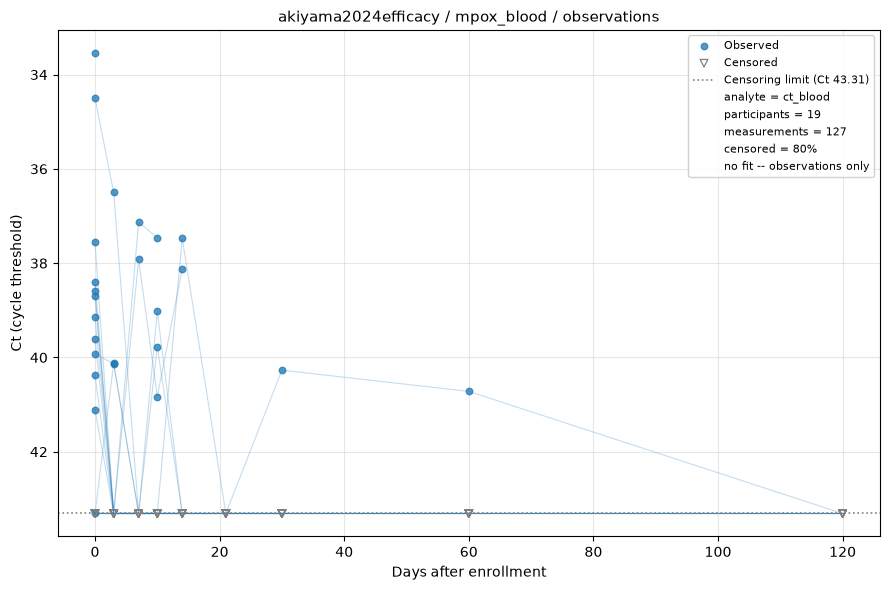
Measurements only — no shedding model is fitted to this analyte, usually because it is sampled once per participant, leaving no trajectory to fit, or because nothing was ever detected. Open triangles are non-detects, drawn at the assay's censoring limit. See the modelling methods for what these estimates do and do not support.
ct_oropharyngeal_swab
Mpox virus PCR cycle threshold (Ct) values from oropharyngeal (throat) swab samples (CSV figure-derived data). Assay details and gene target not provided in the supplied text/CSV.
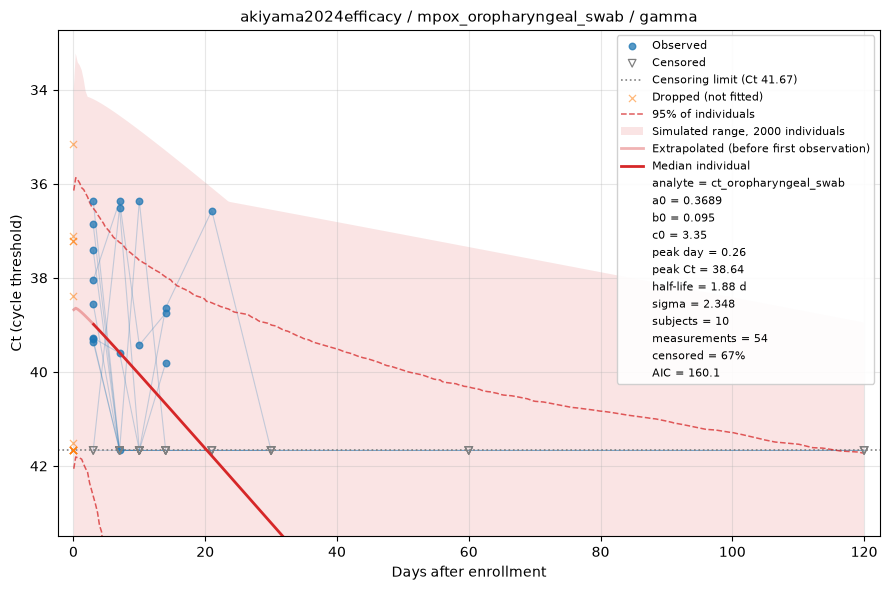
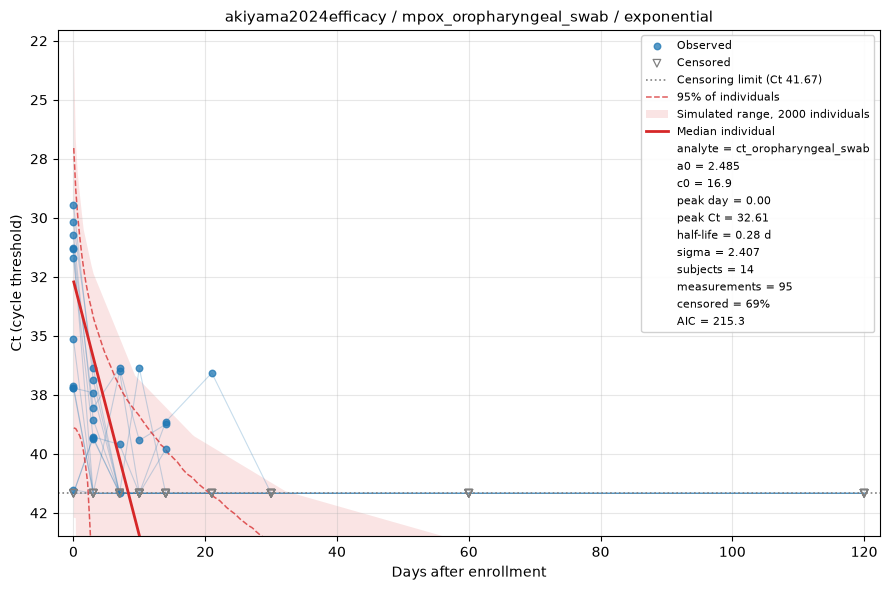
Fitted by censored maximum likelihood. The red line is the median individual; the shaded region is the full range of a simulated cohort drawn from the fitted population, so it shows what simulating from this dataset would produce rather than a confidence interval, with dashed lines at the central 95%. Open triangles are non-detects, drawn at the censoring limit and entering the fit as "below this value" rather than being dropped. See the modelling methods for what these estimates do and do not support.
ct_urine
Mpox virus PCR cycle threshold (Ct) values from urine samples (CSV figure-derived data). Assay details and gene target not provided in the supplied text/CSV.
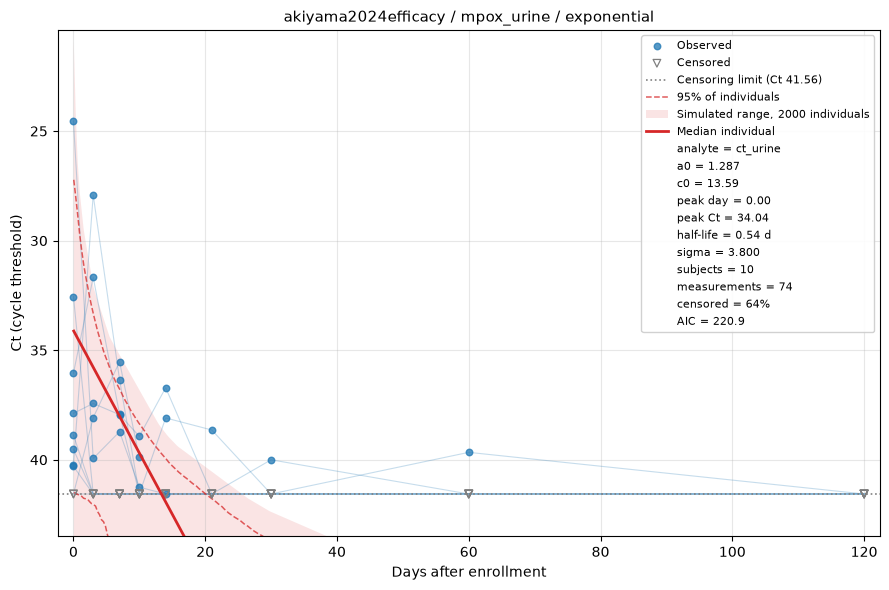
Fitted by censored maximum likelihood. The red line is the median individual; the shaded region is the full range of a simulated cohort drawn from the fitted population, so it shows what simulating from this dataset would produce rather than a confidence interval, with dashed lines at the central 95%. Open triangles are non-detects, drawn at the censoring limit and entering the fit as "below this value" rather than being dropped. See the modelling methods for what these estimates do and do not support.
ct_lesion
Mpox virus PCR cycle threshold (Ct) values from skin lesion specimens (CSV figure-derived data). Assay details and gene target not provided in the supplied text/CSV.
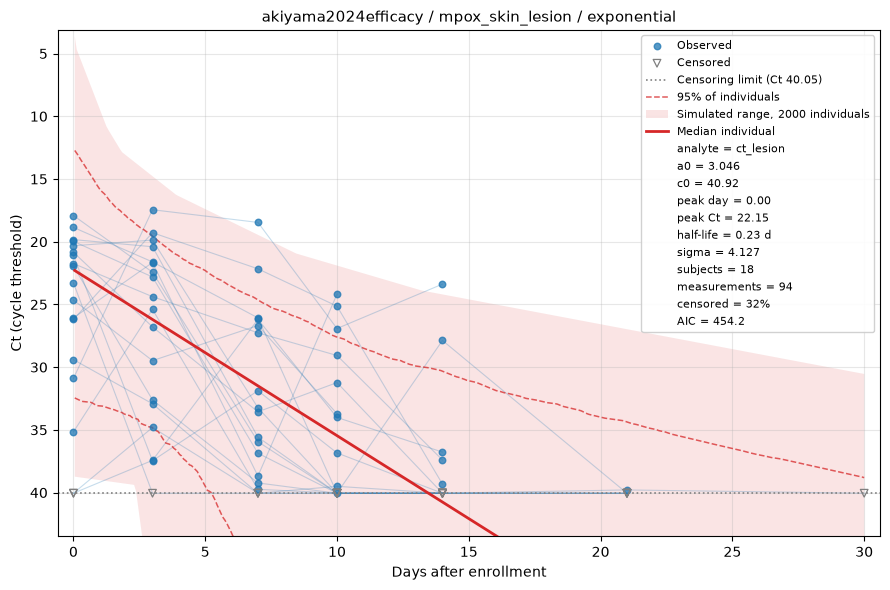
Fitted by censored maximum likelihood. The red line is the median individual; the shaded region is the full range of a simulated cohort drawn from the fitted population, so it shows what simulating from this dataset would produce rather than a confidence interval, with dashed lines at the central 95%. Open triangles are non-detects, drawn at the censoring limit and entering the fit as "below this value" rather than being dropped. See the modelling methods for what these estimates do and do not support.
ct_semen
Mpox virus PCR cycle threshold (Ct) values from semen samples (CSV figure-derived data). Assay details and gene target not provided in the supplied text/CSV.
Measurements only — no shedding model is fitted to this analyte, usually because it is sampled once per participant, leaving no trajectory to fit, or because nothing was ever detected. Open triangles are non-detects, drawn at the assay's censoring limit. See the modelling methods for what these estimates do and do not support.