Virological assessment of hospitalized patients with COVID-2019 woelfel2020virological
The authors conducted a virological analysis of nine linked cases of COVID-19 in Munich in early 2020. They quantified SARS-CoV-2 RNA gene copies in throat swabs and RNA concentrations in stool and sputum samples. Abundances were quantified using RT-qPCR assays targeting the E and RdRP genes as described in 10.2807/1560-7917.ES.2020.25.3.2000045. Values were programmatically extracted from the figure, resulting in a number of significant figures far exceeding the performance of the assays. The demographic data, including age and sex, are derived from the Challenger et al. BMC Medicine (2022) 20:25 https://doi.org/10.1186/s12916-021-02220-0 supplement combined dataset.
Analytes
stool
RNA gene copy concentration in stool samples. The authors report that “stool samples were taken and shipped in native conditions,” suggesting that results reported as gene copies per gram refer to wet weight.
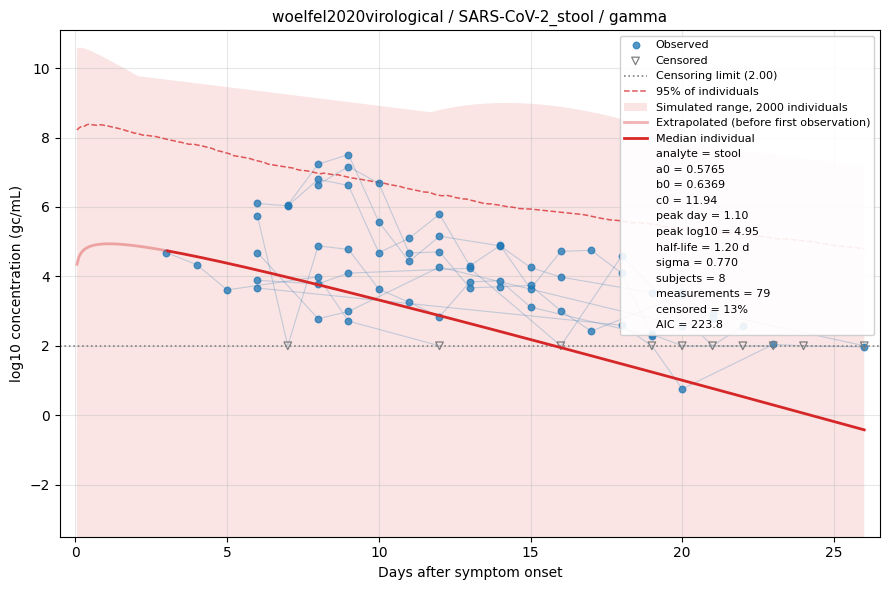
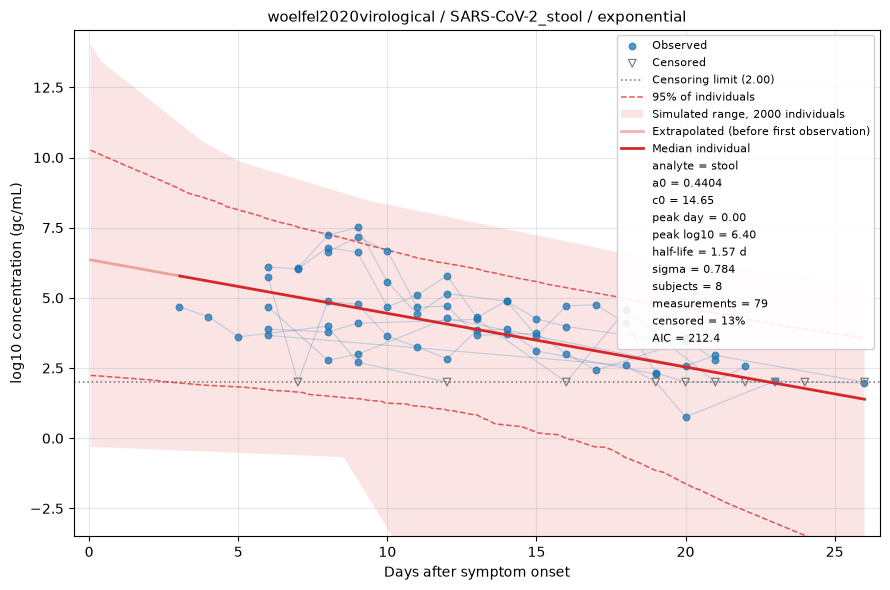
Fitted by censored maximum likelihood. The red line is the median individual; the shaded region is the full range of a simulated cohort drawn from the fitted population, so it shows what simulating from this dataset would produce rather than a confidence interval, with dashed lines at the central 95%. Open triangles are non-detects, drawn at the censoring limit and entering the fit as "below this value" rather than being dropped. See the modelling methods for what these estimates do and do not support.
sputum
RNA gene copy concentration in sputum samples. Results are reported as gene copies per mL.
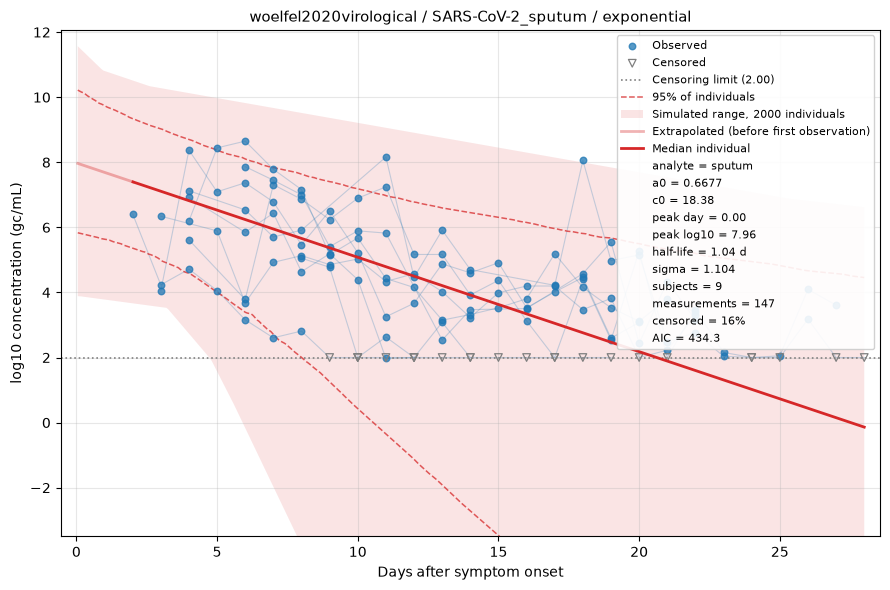
Fitted by censored maximum likelihood. The red line is the median individual; the shaded region is the full range of a simulated cohort drawn from the fitted population, so it shows what simulating from this dataset would produce rather than a confidence interval, with dashed lines at the central 95%. Open triangles are non-detects, drawn at the censoring limit and entering the fit as "below this value" rather than being dropped. See the modelling methods for what these estimates do and do not support.
oropharyngeal_swab
Number of gene copies per throat swab.
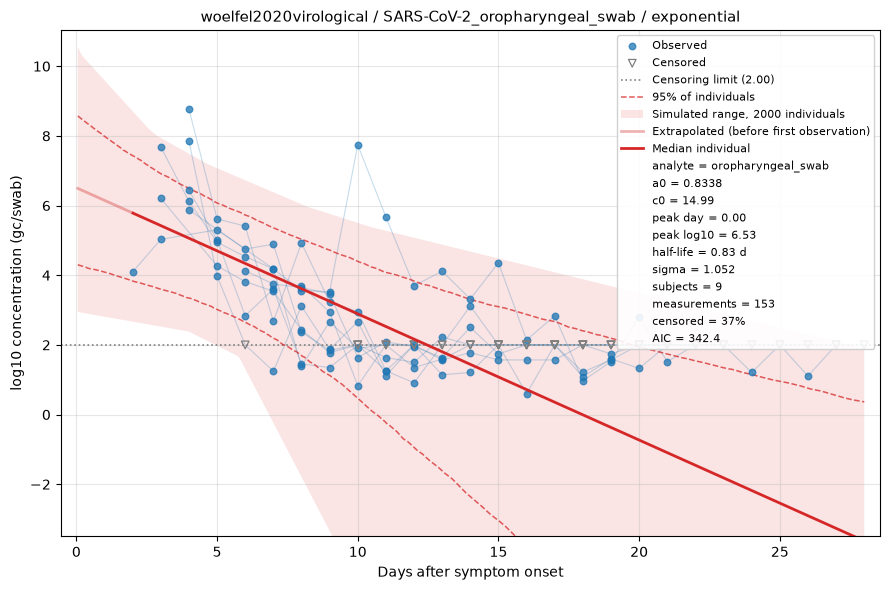
Fitted by censored maximum likelihood. The red line is the median individual; the shaded region is the full range of a simulated cohort drawn from the fitted population, so it shows what simulating from this dataset would produce rather than a confidence interval, with dashed lines at the central 95%. Open triangles are non-detects, drawn at the censoring limit and entering the fit as "below this value" rather than being dropped. See the modelling methods for what these estimates do and do not support.