Epidemiological Correlates of Polymerase Chain Reaction Cycle Threshold Values in the Detection of Severe Acute Respiratory Syndrome Coronavirus 2 (SARS-CoV-2) salvatore2020epidemiological
This study was conducted in Utah and Wisconsin between 23 March and 13 May 2020, with testing data collected during a prospective household transmission investigation of outpatient and mild coronavirus disease 2019 cases.
Analytes
N1_probe
SARS-CoV-2 RNA genome copy concentration calculated from evaluation of both N1 probe. Results were considered positive if signals were detected (Ct < 40) for the RP, N1, and N2 genes. Results were classified as ‘not detected’ if RP was detected but no signal was observed (Ct >= 40) from either N1 or N2. Results were classified as inconclusive if RP was detected (Ct < 40) and either N1 or N2 was detected (but not both). Results were classified as invalid if no RP was detected in the sample. Any specimens for which results were inconclusive were retested; specimens which produced inconclusive results after retesting were excluded from the analysis (n = 17 specimens from 6 participants). Ct values for amplification of both viral targets (N1 and N2 probes). But for further analysis, the author focused on N1 probe
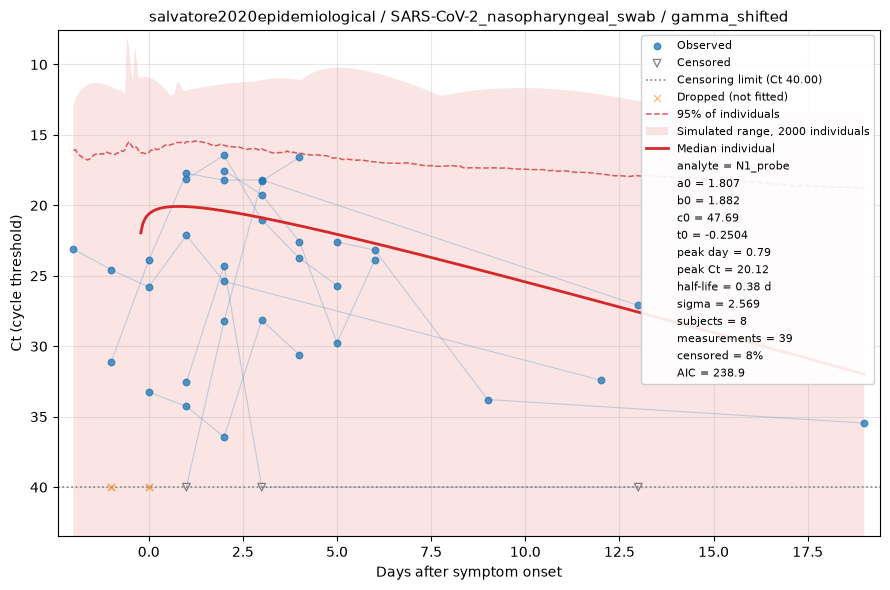
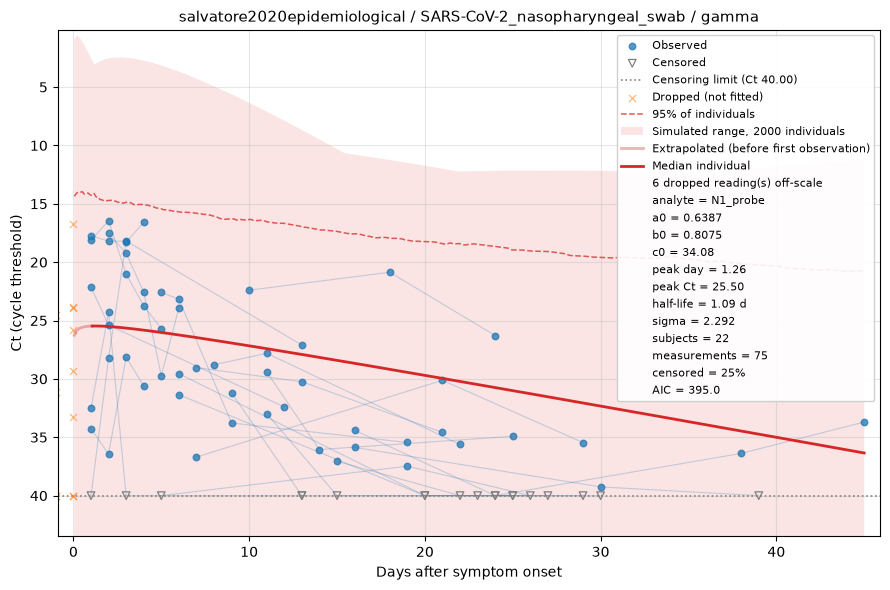
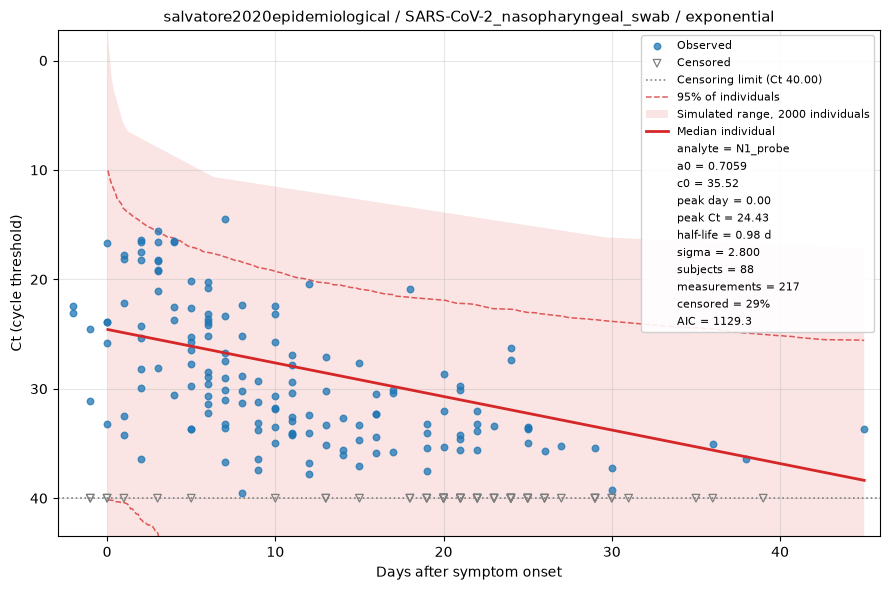
Fitted by censored maximum likelihood. The red line is the median individual; the shaded region is the full range of a simulated cohort drawn from the fitted population, so it shows what simulating from this dataset would produce rather than a confidence interval, with dashed lines at the central 95%. Open triangles are non-detects, drawn at the censoring limit and entering the fit as "below this value" rather than being dropped. See the modelling methods for what these estimates do and do not support.