Viral dynamics of SARS-CoV-2 across a spectrum of disease severity in COVID-19 lui2020viral
Lui et al. report on a prospective cohort study of patients with variable disease severity. Viral loads for positive samples were extracted from Tbl. 1 in the supplementary material, and negatives were extracted manually from Fig. 1 and a figure in the supplementary material. The level of quantification was extracted from methods in the supplementary material. Data for other specimen types, including nasopharyngeal swabs, sputum, plasma, and urine, are also available in the source but have not yet been included here.
Analytes
2019-nCoV_N1
Gene copies of the N1 gene quantified using RT-qPCR in stool samples.
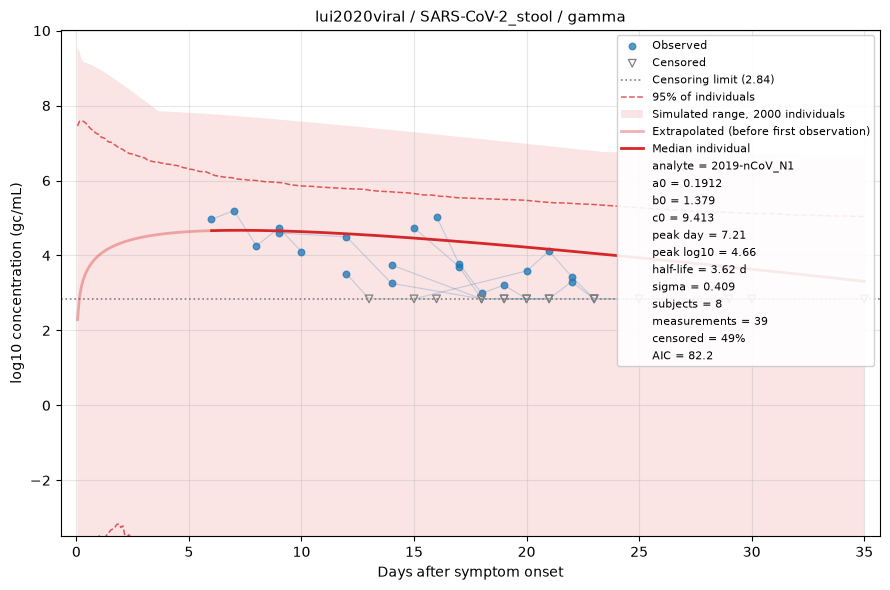
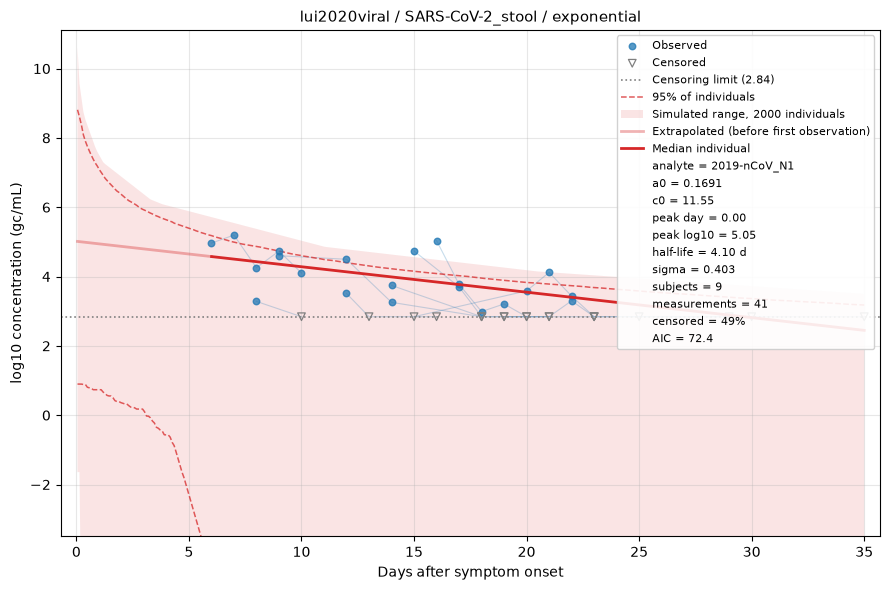
Fitted by censored maximum likelihood. The red line is the median individual; the shaded region is the full range of a simulated cohort drawn from the fitted population, so it shows what simulating from this dataset would produce rather than a confidence interval, with dashed lines at the central 95%. Open triangles are non-detects, drawn at the censoring limit and entering the fit as "below this value" rather than being dropped. See the modelling methods for what these estimates do and do not support.