Daily Longitudinal Sampling of SARS-CoV-2 Infection Reveals Substantial Heterogeneity in Infectiousness ke2022daily
The authors studied the dynamics of infectious virus and viral RNA shedding for SARS-CoV-2 during acute infection through daily longitudinal sampling of 60 individuals for up to 14 days. Nasal swab and saliva samples were collected daily and tested for University of Illinois at Urbana-Champaign faculty, staff, and students (during the fall of 2020 and spring of 2021) who reported a negative RT-qPCR test result in the past 7 days and were either within 24 h of a positive RT-qPCR result or within 5 days of exposure to someone with a confirmed positive RT-qPCR result.
Analytes
nasal_SARSCoV2
SARS-CoV-2 RNA genome copy concentration in mid-turbinate nasal swab (nasopharyngeal swab) samples. Note that the unit of these measurements is per mL: this is because nasal swab samples were each collected in 3 mL of VTM. The calibration curve for nasal samples was in the Supplemental Table S10 in Ke et al. (2022).
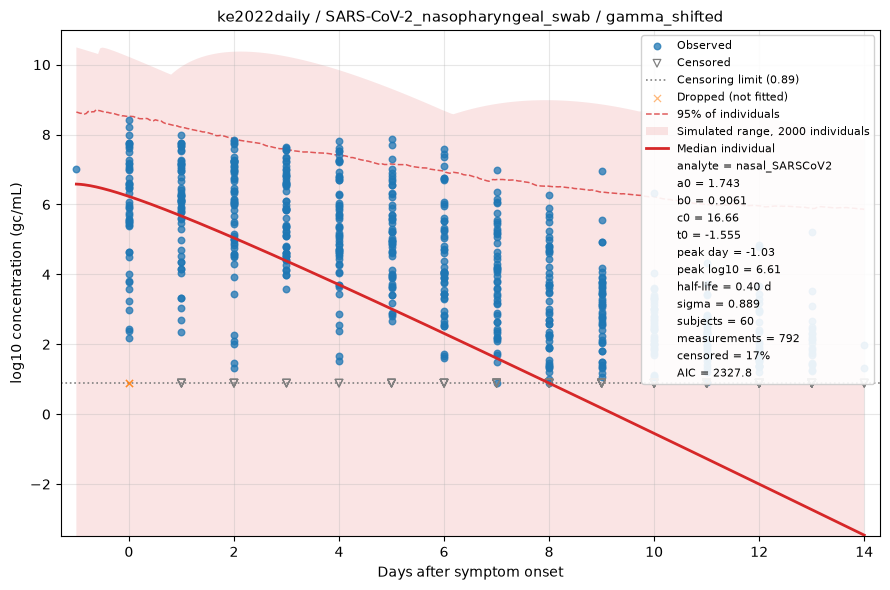
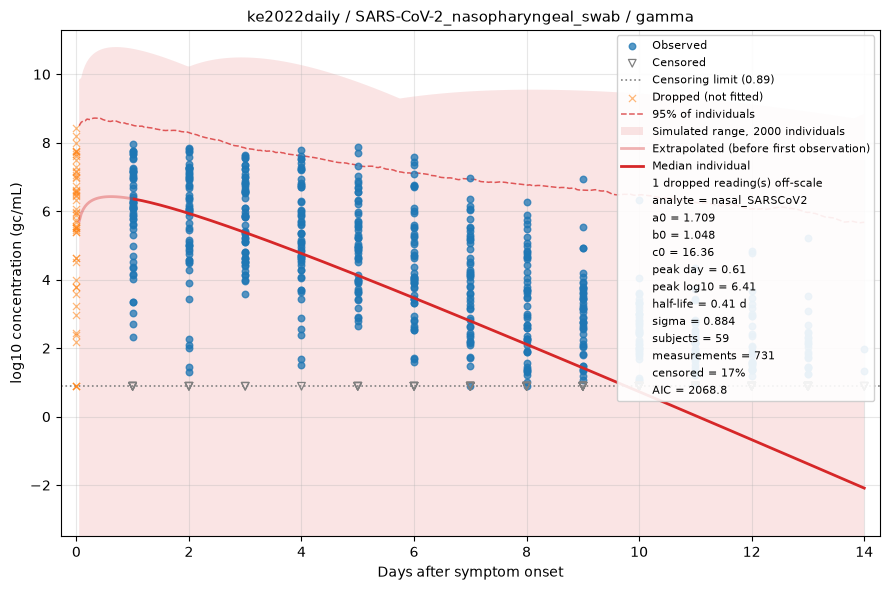
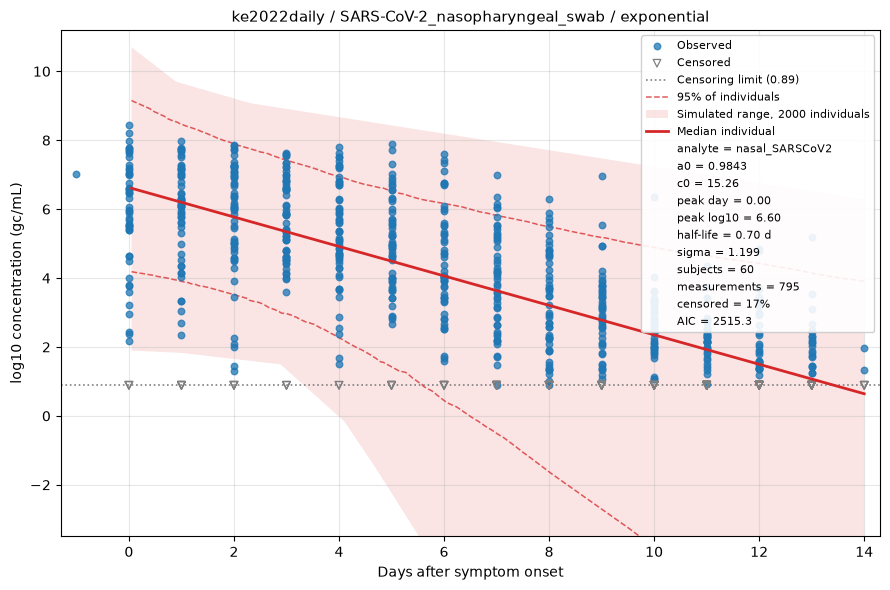
Fitted by censored maximum likelihood. The red line is the median individual; the shaded region is the full range of a simulated cohort drawn from the fitted population, so it shows what simulating from this dataset would produce rather than a confidence interval, with dashed lines at the central 95%. Open triangles are non-detects, drawn at the censoring limit and entering the fit as "below this value" rather than being dropped. See the modelling methods for what these estimates do and do not support.
saliva_SARSCoV2
SARS-CoV-2 RNA genome copy concentration in saliva samples. The study was not able to measure the calibration curve using saliva samples taken from participants. Instead, the authors used data from calibration experiments in which saliva samples obtained from healthy donors were spiked with SARS-CoV-2 genomic RNA. The calibration curve for saliva samples was in the Supplemental Table S11 in Ke et al. (2022).
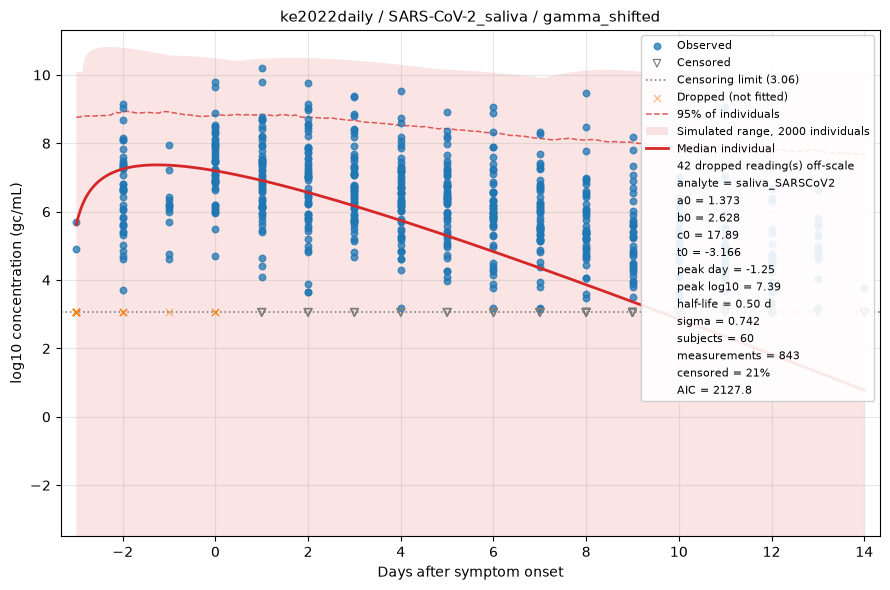
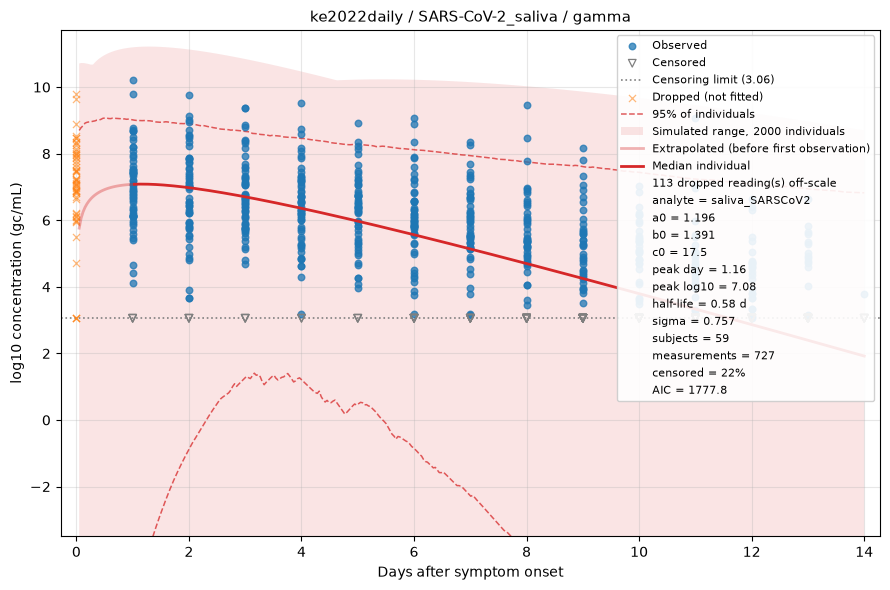
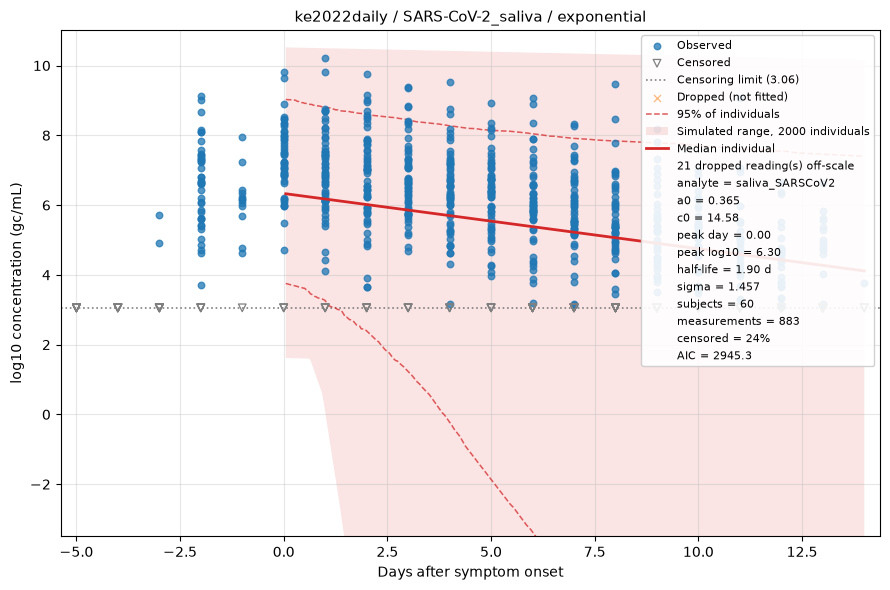
Fitted by censored maximum likelihood. The red line is the median individual; the shaded region is the full range of a simulated cohort drawn from the fitted population, so it shows what simulating from this dataset would produce rather than a confidence interval, with dashed lines at the central 95%. Open triangles are non-detects, drawn at the censoring limit and entering the fit as "below this value" rather than being dropped. See the modelling methods for what these estimates do and do not support.